Download
1 / 26
260 likes | 378 Views
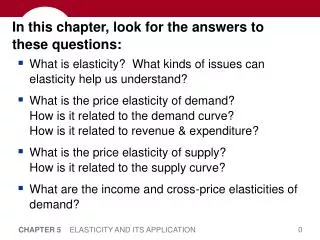
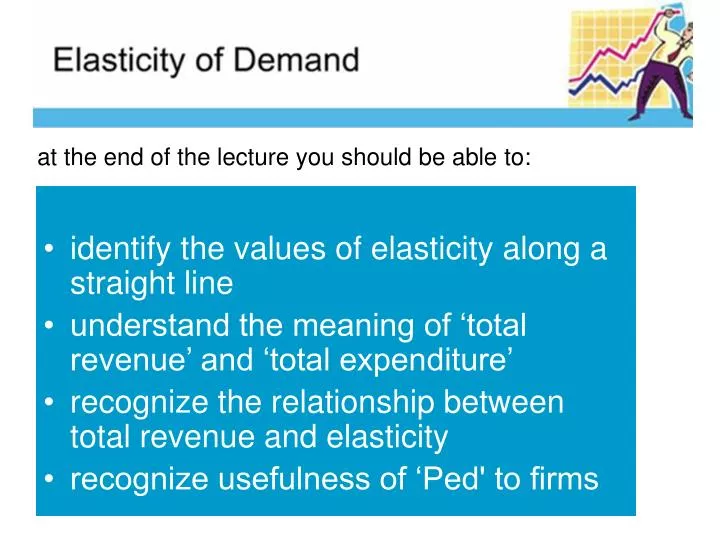
identify the values of elasticity along a straight line understand the meaning of ‘total revenue’ and ‘total expenditure’ recognize the relationship between total revenue and elasticity recognize usefulness of ‘Ped' to firms. at the end of the lecture you should be able to:.

E N D
identify the values of elasticity along a straight line • understand the meaning of ‘total revenue’ and ‘total expenditure’ • recognize the relationship between total revenue and elasticity • recognize usefulness of ‘Ped' to firms at the end of the lecture you should be able to:
Measurement of elasticity: using the average or 'mid-point' method Elasticity along a straight line:
A Different elasticities along a straight-line demand curve B Ped at pt A = P C D Demand E Q fig
A Different elasticities along a straight-line demand curve Ped at pt A = ∞ B P C D Demand E Q fig
A Different elasticities along a straight-line demand curve Ped at pt B = B P C D Demand E Q fig
A Different elasticities along a straight-line demand curve Ped at pt B =BE/BA B P C D Demand E Q fig
A Different elasticities along a straight-line demand curve Ped at pt B = > 1 B P C D Demand E Q fig
A Different elasticities along a straight-line demand curve Ped at pt C = B P C D Demand E Q fig
A Different elasticities along a straight-line demand curve Ped at pt C =CE/CA B P C D Demand E Q fig
A Different elasticities along a straight-line demand curve Ped at pt C = 1 B P C D Demand E Q fig
A Different elasticities along a straight-line demand curve Ped at pt D = B P C D Demand E Q fig
A Different elasticities along a straight-line demand curve Ped at pt D = DE/DA B P C D Demand E Q fig
A Different elasticities along a straight-line demand curve Ped at pt D = <1 B P C D Demand E Q fig
A Different elasticities along a straight-line demand curve Ped at pt E = B P C D Demand E Q fig
A Different elasticities along a straight-line demand curve Ped at pt E = 0/ EA B P C D Demand E Q fig
A Different elasticities along a straight-line demand curve Ped at pt E = 0 B P C D Demand E Q fig
A Different elasticities along a straight-line demand curve Ped >1 B Ped =1 P C Ped <1 D E Q fig
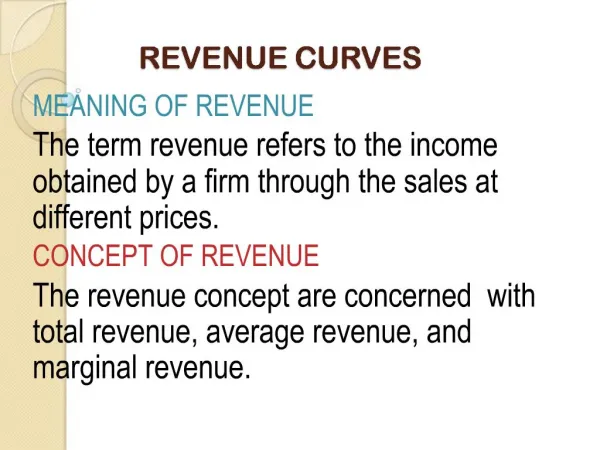
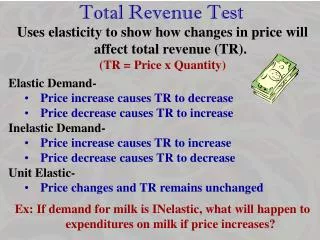
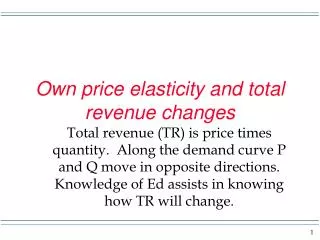
ELASTICITY • Price elasticity of demand and consumer expenditure (P x Q) • effects of a price change on expenditure: elastic demand
Total expenditure P(£) Consumers’ total expenditure = firms’ total revenue = £2 x 3m = £6m D fig Q (millions of units per period of time)
Expenditure falls as price rises b 5 4 20 10 Elastic demand between two points P(£) a D 0 fig Q (millions of units per period of time)
effects of a price change on expenditure: elastic demand • effects of a price change on expenditure: inelastic demand • Ped and consumer expenditure (P x Q)
Expenditure rises as price rises c 8 a 4 15 20 Inelastic demand between two points P(£) D 0 fig Q (millions of units per period of time)
Price elasticity of demand and consumer expenditure (P x Q) • effects of a price change on expenditure: elastic demand • effects of a price change on expenditure: inelastic demand • special cases
b 8 100 Unit elastic demand (PÎD = –1) P a 20 D 40 O Q fig
b Q2 Infinitely elastic demand (PÎD= ¥) P a D P1 Q1 O Q fig
b P2 Totally inelastic demand (PÎD= 0) P D a P1 Q1 O Q fig