Download
1 / 15
160 likes | 365 Views
The Effects of Expectations on Standardized Testing. Kaylee Mulgrew. Question. Will different expectations affect the performance and the overall scores of a standardized test?. Background Information. standardized tests tests the aptitude of students in different subjects and areas.

E N D
The Effects of Expectations on Standardized Testing Kaylee Mulgrew
Question • Will different expectations affect the performance and the overall scores of a standardized test?
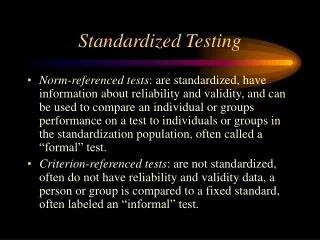
Background Information • standardized tests • tests the aptitude of students in different subjects and areas. • used because the material on the test is general • Open ended questions do not have a provided answer. Closed questions have choices. • surveys • avoid slang • avoid strong adjectives • avoid the words and andnot • cover all the answers • Convergent thinking is “the ability to focus in on a single solution to a problem.”
Hypothesis • If a perception or prediction about the difficulty of a standardized test is given to a subject, then the subject’s expectation will be reflected in the test score.
Materials • Pens and Pencils • Computer • Calculator • Timer • Paper • Human Subjects • SAT Preparation Book
Procedure • Two surveys were made • before testing • after testing • A test with standardized questions was made. • from SAT test books • Writing, Math and Critical reading sections • A brief and general explanation of the matter on the test and the difficulty level was given. • The first survey was completed. • The surveys were collected, and the tests were distributed. • Participants were not allowed to read the test or pick up their pencils until everyone received a test. An allotted time of ten minutes was given for each section, and after the time was up, the tests were collected. • The second survey was distributed and then collected when the participants were finished. • The tests were scored, by using a proportional system. The whole test was worth 2400 points.
Variables • Independent Variable • Group A and Group B • Dependent Variable • Test Scores and Survey Ratings • Control • Group C • Constants • Standardized test, the time allotted to take the test, gender of the participants, surveys
Conclusion • The purpose of this experiment was to see if expectations would affect performance on a standardized test. • Further questions • Does a one year difference in education really affect the scores of a standardized test? • Also, can a similar process be used to test other types of expectations such as expectations for school, sports, and family life? • people should not get overwhelmed by their expectations • The experiment should have been tested on a variety of people, who belong to the same education level and a larger test pool. Also, the standardized test should be shortened, and the answer sheet should correspond to the test.
Discussion • The hypothesis was rejected. • no statistical difference • Two science classes were tested in each group • one regular • one honors • On the first survey, the first question asked what the participants thought the test’s difficulty would be. • Group A -4 • Group B -8 • Group C -6 • On the first survey, the second question asked the participants to rate how they believed they would perform on the test . • Group A -8 • Group B -5 • Group C -7 • In the second survey, the first questions asked the participant to rate the difficulty level after taking the test. • Group A and Group B -8 • Group C -7 • The second question from the second survey asked the participants how they believed they performed on the test • Group A and Group B -4 • Group C -5
Sources of Error • The participants in honors courses scored higher and thought the test would be easier. • In Group B, an honors freshman class was tested instead of an honors sophomore class. • The answer sheet to the standardized test had bubbles for answers a, b, c, and d, but not e. • Participants started to lose interest and focus toward the end of testing. • Subjects many not have taken the test seriously. • The subjects consisted only of females from the ages of fourteen to sixteen.
References • About the SAT. (2011). What does the SAT test. Retrieved October 5, 2011, from http://sat.collegeboard.org/why-sat/topic/sat/what-is-the-sat • Brain & Nervous System Health Care. (2009, October 1). Retrieved October 7, 2011, from http://www.webmd.com/brain/picture-of-the-brain • Chuldler, E. H. (2011). The Synapse. Retrieved October 18, 2011, from http://faculty.washington.edu/chudler/synapse.html • Davidmann, M. (1998). How the Human Brain Developed and How the Human Mind Works. Retrieved October 7, 2011, from http://www.solhaam.org/articles/humind.html • Frontal Lobes. (2011). Retrieved October 19, 2011, from http://www.neuroskills.com/tbi/bfrontal.shtml • How the SAT is Scored. (2011). Retrieved October 7, 2011, from http://sat.collegeboard.org/scores/how-sat-is-scored • Johnson, G. S., Jr. (2002). About Brain Injury:A Guide to Brain Anatomy, Function and Symptoms. Retrieved October 7, 2011, from http://www.waiting.com/brainfunction.html • Key, J. P. (1997). MODULE S5 - “t” TEST. Retrieved January 29, 2012, from http://www.okstate.edu/ag/agedcm4h/academic/aged5980a/5980/newpage26.htm • McNamara, C., MBA, PhD. (n.d.). Basics of Developing Questionnaires. Retrieved October 7, 2011, from http://managementhelp.org/businessresearch/questionaires.htm • Occipital Lobes. (2011). Retrieved October 19, 2011, from http://www.neuroskills.com/tbi/boccipit.shtml • Outtz, Goldstein, & Ferreter. (2005, April). Convergen and Divergent Thinking: Examining the Impact of Test Response Format on Subgroup Differences. Retrieved October 20, 2011, from http://www7.nationalacademies.org/cfe/outtz_presentation_21century_skills.pdf • Parietal Lobes. (2011). Retrieved October 19, 2011, from http://www.neuroskills.com/tbi/bparieta.shtml • Robinson, Adam, and Jeff Rubenstein. Cracking the PSAT. 2011 Edition ed. NewYork: Random House, Inc., 2010. Print • Spinal Cord Anatomy. (2010). Retrieved October 18, 2011, from http://www.apparelyzed.com/spinalcord.html • Stevenson, J., BS, MS. (1998). The Human Brain. Retrieved October 19, 2011, from http://www.onelife.com/author.html • Temporal Lobes. (2011). Retrieved October 19, 2011, from http://www.neuroskills.com/tbi/btemporl.shtml • Young, K. (2005). Examples. Retrieved October 6, 2011, from http://www.msu.edu/~youngka7/testing.html