Download
1 / 37
370 likes | 469 Views
NEW EUROPE DIVISION 2003-2006 STRATEGIC PLAN Roberto Nicastro Head of New Europe Division. Investor Day – Bologna, 13 th June 2003. UCI’S NEW EUROPE CHALLENGE: THE KEY POINTS WE HOPE WILL COME ACROSS. By and large the New Europe region will allow good growth for the banking activity.

E N D
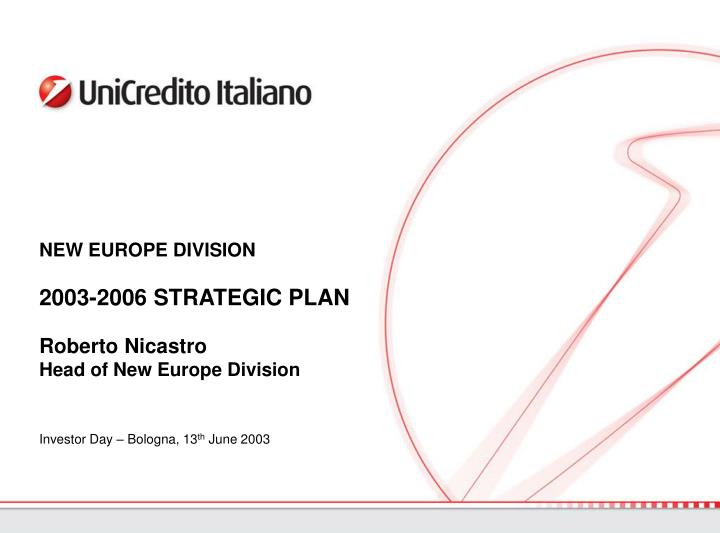
NEW EUROPE DIVISION2003-2006 STRATEGIC PLANRoberto NicastroHead of New Europe Division Investor Day – Bologna, 13th June 2003
UCI’S NEW EUROPE CHALLENGE: THE KEY POINTS WE HOPE WILL COME ACROSS • By and large the New Europe region will allow good growth for the banking activity • Developing this opportunity requires to forge and implement one of the first examples of truly cross border retail banking - where we need to strike the right balance between “McDonald-banking” and tailor-made “Boutique banking” • Are we succeeding? We think so. “Industrial” progresses are evident, financial results are positive. Poland’s environment could be much better - but maybe there we’ve just hit the rock bottom …
AGENDA New Europe: Why and How Recent Results Strategy and Business Model Three Year Plan: the Targets Conclusions
HIGHER GROWTH IN THE RECENT PAST AND IN THE NEAR FUTURE • A positive gap in terms of regional growth, compared to the EU market, both in the recent past and in the forthcoming period Real GDP growth % • Of which: • Poland: 2.1% • Other: 4.3% 5 • Expected GDP catching up driven by: • Internal demand • FDIs • Export, as a consequence of further exploitation of comparative advantages • Structural funds 2000 2001 2002 2003e 2004-06 • Gap in GDP growth likely to persist for decades, as the experience of past EU enlargement processes shows (i.e. Ireland, Spain and Portugal) * New Europe EU * Excluding Turkey. NEC: Poland, Bulgaria, Slovakia, Croatia, Romania, Hungary; Czech Republic; Slovenia, Turkey, 3 Baltic countries
EU ACCESSION IS GETTING CLOSER FOR MOST OF OUR NEW EUROPE COUNTRIES IN A CONTEXT OF DECLINING RISKS AND GROWING STABILIZATION 2002 INFLATION (avg) • Lower than 3%2 Poland, Croatia, Czech Republic, Latvia, Lithuania EU4 avg. 2.1 • Between 3 and 10% Bulgaria, Estonia, Hungary, Slovakia, Slovenia BG • Higher than 10% Romania, Turkey HR 2002 PUBLIC DEFICIT (%GDP) • Lower than 3% Bulgaria, Estonia3, Latvia, Lithuania, Romania CZ EU4 avg. 1.9 • Between 3 and 7% Slovenia, Croatia, Czech Republic, Poland PL RO • Higher than 7% Hungary, Slovakia, Turkey 2002 PUBLIC DEBT (%GDP) SK • Lower than 60% Bulgaria, Croatia, Czech Rep., Estonia, Hungary, Latvia, Lithuania, Poland, Romania, Slovakia, Slovenia EU4 avg. 62.5 TK • Higher than 60% Turkey 1 Estimated 3Estonia in surplus 2 The Maastricht criteria prescribes inflation to be no more than 1.5% above the average inflation rate of the lowest 3 inflation countries in the EU. The 3% threshold is thus indicative. 4EU 15 countries
Warsaw Prague Bratislava 22.6% 49.1% Zagreb Bucarest Sofia 6.7% Istanbul 13.2% 3.2% 1.4% UCI HAS ACQUIRED A WIDESPREAD PRESENCE IN NEW EUROPE, BEING AMONG THE TOP PLAYERS IN EACH MARKET Group Pekao - Poland UniBanka - Slovakia 76.3% acquired in October 2000 53.2% acquired in May 1999 Total assets (Euro mln) Market share on Loans Market share on Deposits Net income (Euro mln) Branches 847 6.1% 3.3% 5 66 Total assets (Euro mln) Market share on Loans Market share on Deposits Net income (Euro mln) Branches 15,750 13.2% 15.9% 195 832 UniCredit – Romania 99.8% acquired inMay 2002 Zagrebacka Group-Croatia Bosnia-Herzegovina 81.9% acquired in March 2002 Total assets (Euro mln) Market share both on Loans and on Deposits Net income (Euro mln) Branches 105 1% 2.9 15 Total assets (Euro mln) Market share on Loans Market share on Deposits Net income (Euro mln) Branches 7,190 22.6% 31.7% 103 180 Bulbank - Bulgaria 85.2% acquired in October 2000 Total assets (Euro mln) Market share on Loans Market share on Deposits Net income (Euro mln) Branches 1,406 8.8% 19.7% 40 91 Pioneer Zivnostenska Banka Czech Rep. Total AuM in New Europe of Euro 1,7 bn (as at 31.03.03) 95.04% acquired in February 2003 Koç Fin. Serv. - Turkey Total assets (Euro mln) Market share both on loans and on dep. Net income (Euro mln) Branches 1,651(1) 2.4% 3.8(1) 29 50% acquired in October 2002 Total assets (Euro mln) Market share on Loans Market share on Deposits Branches(2) approx. 4,750 8.5% 3.5% 115 3.9% End of 2002 data Other presences: Pekao Ukraina, Koc Azerbaijan (1) Source: IAS, audited data Contribution to New Europe Total Revenues (only UCI’s portion as at 31.03.03 - pro-forma including the management account figures of Zivnostenska) (2) Data related to Kocbank
29.8 25.4 31.8 22.1 17.6 11.8 12.5 14.1 UCI IS AMONG THE CLEAR LEADERS IN THE REGION Data as at Dec. 2002 (1) Total Net Profit (mn Euro)(4) N. of branches Total Assets (bln Euro) # of countries with banking presence Pro quota Controlled (1) UCI(2) 349 1,332 7 233 291 ERSTE 4 1,221 254 KBC(3) 200 1,021 5 166 HVB/BA 304 (5) 8 880 268 SOC GEN 357 4 614 211 107 RZB 8 524 92 INTESA 178 419 3 155 CITIGROUP(6) 178 215 7 (1) 100% of total assets and profit after tax for controlled Companies (stake > 50%) and share owned for non controlled companies (I.e. 50% Kfs) (4) After tax, before minority interest (5) HVB only pre-tax data available (2) Including KFS and Zivnostenska (6) Pro quota not available (3) Including Nova Ljubljanska Banka Source: UCI Economic Research
AGENDA New Europe: Why and How Recent Results Strategy and Business Model Three Year Plan: the Targets Conclusions
RECENT GROWTH SUBSTANTIAL BOTH BY SIZE AND BY VALUE CREATION Capital Invested EVA ROE (Euro mln) (Euro mln) 45.8 CAGR +29.4% +10.7 pp 2,6081 20002 14.9% 2002 1,205 4.2% -40 1999 now 1999 2002 Total Revenues Operating Income Cost/Income (Euro mln) (Euro mln) CAGR +28.5% CAGR +51.2% 1,668 -19.5 pp 69.0% 843 49.5% 786 244 1999 2002 1999 2002 1999 2002 At Current FX Perimeter for 1999: Group Pekao only; for 2000 and 2001: Group Pekao, Bulbank, Unibanka and Splitska (sold in Apr. 02); for 2002: Group Pekao, Zagrebacka Banka, Bulbank, UniBanka, UniCredit Romania 1 Including KFS and Zivno (the impact of the tender offer is also included) 2 Including only Pekao
Net customer loans (+4.9% y/y, +3.4% on Dec02 at unchanged FX) hit by decreased lending in Pekao more than counterbalanced by the other banks • Direct deposits (-2.4% y/y, -1.0% on Dec02 at unchanged FX) with a higher weight of securities (from 0.8% in 1Q02 to 2.1% in 1Q03) mainly driven by increased bonds in Pekao (in Poland market deposits are down) • Assets under Management: 2.3 bn in 1Q03, +33% y/y, +8.1% on Dec02 • Volumes KEY HIGHLIGHTS OF THE FIRST PART OF THE YEAR • Divisional results negatively affected by the still not favourable macroeconomic environment (stagnant GDP, WIBOR from 10.3% to 5.7% in 12 months) and FX impact in Poland (Zloty devaluation -18.8% y/y, -9.0% on Dec02) • Increased net income of the division in the last quarter to 64 mln in 1Q03 (-7.7% y/y, +18.1% on Avg02 at unchanged FX) supported by an overall good cost control and a lower impact of Pekao’s provisioning • Net interest income down by 10.9% y/y at unchanged FX as a result of a significant decrease at Bank Pekao – 20.7% y/y (3/4 spread on deposits, 1/4 spread on securities/free capital) and a good growth for the other banks • Growth in commissions +8.0% y/y at unchanged FX,despite drop in loan fees at Pekao thanks to buoyant Asset Management and Bancassurance and loan growth in the other banks • Revenues
KEY ACHIEVEMENTS IN THE FIRST PART OF THE YEAR KFS PEKAO • Investment Funds +40.2% • Bancassurance at full speed (Euro 4.6 mln since March, 30% is new money) • 50,000 accumulation plans sold in 4 months • Staff decreasing 2.7% (-450 April on Dec02) • Securities under Custody +34% • Cards +4.9% • Letters of Credit +13.8% UNIBANKA • Mortgages from 0.56 to 1.62 mln Euro • Packages +27.6% • AUM +3.5% ZABA UCROMANIA • Mortgages +17.7% • Cards +6.4% • AUM +11.5% • +27% Italian Desk clients (400 in 10 months) ZIVNO BULBANK • New Customer acquisition +3.9% • Retail Loans up 17.6% • Corporate loans +13.1%
ASSET QUALITY IN NEW EUROPE NEGATIVELY IMPACTED BY ECONOMIC SCENARIO IN POLAND, IMPROVEMENT IN ALL OTHER COUNTRIES Net NPLs and Doubtful Loans as % of Total Net Loans Coverage ratios Net Doubtful/Loans % 1Q03 80.3 80.3 Net NPL/ Loans % 1Q03 ch. on Dec02 (pp) ch. on Dec02 (pp) At unchanged FX 63.5 62.5 Pekao 4.1 12.3 +0.3 +1.0 Zaba 2.5 4.9 -0.4 -0.5 KFS 4.0 8.6 -0.7 -0.5 2002 1Q03 Bulbank 0.2 2.5 -0.1 -0.7 On Gross Doubtful Loans On Gross NPLs Unibanka 4.1 4.9 -0.2 -0.4 Total NE 3.5 -0.0 9.3 +0.4 • Stable net NPLs/Net Loans ratio • Net Doubtful/Loans ratio up 0.4% on Dec02 impacted by a not favourable macroeconomic environment in Pekao nearly counterbalanced by an improvement in all other NE banks (Zaba -0.5pp, KFS –0.5 pp, Bulbank -0.7pp, Unibanka -0.4pp onDec02) At unchanged FX Dec 02 1Q03 % ch. (Euro mln) +7.7 1,076 Net Doubtful Loans 999 Net NPLs +3.1 396 408 • Stable coverage ratio on gross NPLs loans, slight decrease on gross Doubtful due to a different mix (lower weight of NPLs) Net Loans +3.4 11,178 11,553
UCI’s NEW EUROPE INVESTMENTS ARE PAYING OFF 2002 ROI1 Investment (Euro mln) Pekao 9% 1,205 Zaba 614 14% Bulbank 242 14% UniBanka 5% 80 UCRomania 22 13% Total 2,163 11% KFS 251 n.m. Zivnostenska2 194 n.m. Total Division 2,608 n.m. 1 Calculated on FY02 net income for the Group; FX as at 31.12.02 2 Including the impact of the tender offer
AGENDA New Europe: Why and How Recent Results Strategy and Business Model Three Year Plan: the Targets Conclusions
OVERALL OUTLOOK IN THE REGION MAINLY POSITIVE + + + Volumes growth (loans, deposits, services) + Decreasing risks + Sound industry structure + Taxation decreases Some margins pressure on domestic currency business with convergence - - Basel II impact - (Limited) Devaluations
NEW EUROPE DIVISION: MACROECONOMIC SCENARIO • Overall positive part of the economic cycle • 18-24 months favourable outlook, with positive GDP growth differential vs. EU. Given still slow EU recovery, internal demand continues to be the main engine of growth • Back to long term growth potential for Poland (3.6 - 4.4% growth in 2004 and 2005 respectively) and the Czech Republic (3.6 – 3.9% respectively), following recent slowdown • Continuation of positive growth dynamics in all other New Europe countries (with rates between 4% and 5%), with economic stabilisation and growth supported by EU convergence • Tax rates stabilization at current low level • EU enlargement process (first round of accessions in May 2004) and first convergence steps towards Monetary Union • Different lifecycle stages, 3 waves of entrants • 2004 entrants: Poland, Slovak, Czech Republic • 2007 entrants: Bulgaria, Romania, Croatia (to be confirmed) • potential entrants or “close neighbours”: Turkey (Russia, Ukraina, …) • Macro stabilisation and operating environment convergence to best standards • Lower level of risk • Expected increase in labour cost
NEW EUROPE DIVISION: BANKING SECTOR SCENARIO • Continuous growth of volumes in NE Countries (loans, deposits, AuM and services): • Pressure on local currency banking margins, due to convergence towards EU interest rate levels • NE Banks already operating in hard currency for a relevant part of their activities (45% at Division level) • Potential impact of Basel II • Unclear impact on capital requirements • Potential competitive advantage of local players not adopting advanced models • Increase in relative attractiveness of retail lending (Loans+Deposits)/ GDP 2002 Lending growth Deposit growth CAGR 13% CAGR 10% 224% 66% New Europe EU 2002 2002 2006 2006
A NETWORK (NOT A PATCHWORK) OF SEVEN MULTIBUSINESS NATIONAL BANKS STRATEGY GOVERNANCE IT SYSTEMS ORGANIZATION PRODUCT SHELF RISK SYSTEMS HR SYSTEMS & TRAINING
OUR VISION FOR NEW EUROPE CROSS BORDER BANKING ... In 2006 the New Europe Division will be composed by a network (not a patchwork) of twin banks run by strong local management teams … … driven by the same strategy, leveraging on the same business and organisation model, the same products and the same processes with strong central guidance … … but also capable to adjust to the local differences (cultures, legacies, stages of lifecycle, regulations) … … so as to become one of the first successful cross-border retail banks … … striking the right balance between “McDonald banking” and “Boutique banking”
STRATEGY … WITH A COMMON STRATEGY BY SEGMENT FOCUSED ON THE MOST ATTRACTIVE ONES … 2002 Total Number of customers (‘000) 6,000 2005 market revenue pool size = 500 Mln Euro Selective development, fee-driven Segment Strategy Market revenues growth (CAGR ’01-’05, %) 20% Large Corporate 5 Private Mid corporate Specialised service model 42 15% Affluent Highly differentiated service model Small Business 14 Private 10% Affluent/ Small Business Mid Specialised service model 900 Mass Large Cost focus Cross selling (bancassurance, mortgage, credit cards) 5% 0% 20% 40% 60% 80% 100% 120% 140% 160% 5,000 Mass 2005 Net profitability (ROE , %) Source: UCI’s analysis at a constant exchange rate Number of customers (‘000), excluding dormant customers (KFS is included at 100%)
STRATEGY ... AND WITH SOME DIFFERENCES LINKED, INTER ALIA, TO ECONOMIC LIFECYCLE OF COUNTRIES AND STARTING POSITION Early Markets Advanced Markets Starting Point (mkt share) ZABA BULBANK Clear Leaders PEKAO KFS ZIVNO Rising Leaders UCR UNIBANKA Economic Life Cycle (GDP per capita)
MANAGEMENT BOARD Manages the bank deciding key issues, evaluating projects, strategies and development plans GOVERNANCE COMMON GOVERNANCE: ROLES OF GOVERNANCE BODIES SUPERVISORY BOARD AUDIT COMMITTEE PROJECT COMMITTEE
PRODUCT SHELF COMMON ADVANCED PRODUCT SHELF AND JOINT FACTORIES Banks that have full availability(1) Banks that have full availability(1) RETAIL CORPORATE Mortgage 6 FX/Basic Derivatives 7 Mutual Funds 6 Cash Management/E-banking 7 Bancassurance 5 Leasing 6 Package for Current Account 4 Factoring 5 Pension Funds 4 Advanced Derivatives (CorporateLab) 2 SB Package 3 Revolving Credit Card 3 3 Structured Products NEW EUROPE FACTORIES • Asset Management • TradingLab • Card Processing • CorporateLab • Leasing (1) As of May, 31 2003
ORGANISATION BENCHMARK ORGANISATION AND SERVICE MODELS • Zaba • KFS • Bulbank • Zivno • Pekao • UniBanka • UCR DIVISIONALISATION IN PROGRESS FULLY DIVISIONALIZED CEOs/COOs Family Banking Division Private Banking Division Corporate Banking Division SB/Affluent Division Segment dedicated Corners/ Points of Sale1 109 30 248 1,012 Specialised Account Managers/ Hunters/ Sales People Other2 623 47 1,259 2,590 1,718 TOTAL FRONTLINE: 18,500 • Pekao: 12,000 • UniBanka: 480 • UCR: 175 • Zaba: 2,900 • Bulbank: 1,190 • KFS: 1,470 • Zivno: 310 1 Excluding KFS and Zivno 2 KFS (100%), Zivnostenska and other non segment dedicated sales-force
ORGANISATION BENCHMARK ORGANISATION AND SERVICE MODELS DIFFERENT STAGES OF COMPLETION IN KEY AREAS • MISSION OF TREASURY • Limited proprietary portfolio • Focus on commercial activities on behalf of customers • OUTSOURCING • Maintenance and building • Security • Cash handling • Management of mailings • … BENCHMARKING AND IMPLEMENTATION OF BEST PRACTICE BUSINESS MODEL • PURCHASING CENTRALIZATION • KEY OPERATING PROCEDURES • Credit underwriting • Budgeting/strategic planning • Antimoney laundering • … • BRANCH MODEL • BACK-OFFICE ORGANIZATION
IT SYSTEMS SAME TARGET IT SYSTEMS AND APPLICATIONS IT POLICY IS BASED ON: • Development of homogeneous target systems for strategic application areas (Credit, MIS/CRM, Sales Force management, architecture, facility management), with tailored approach for language, regulations and legacies • Reliance on standardized/already tested IT solutions and applications (minimise proprietary development; decrease cost/elapsed time) • Reduce Operative Risks (Disaster recovery/Business continuity solution; anti money laundering) • Improve time to market through a centralized development approach • IT STRATEGIC FOR: • Revenues boost • Cost of risk • Operating risk • Operating costs • “CLONE” IT SYSTEMS • “CLONE” APPLICATIONS
RISK SYSTEMS SAME TARGET RISK SYSTEMS AND PROCEDURE, BY THE END OF 2004 IN ALL BANKS Underwriting Management Workout Cross-bank project • Electronic underwriting tool • Credit rating system 4. Credit management system 6. Workout Unit Corporate 8. New credit corporate governance 9. Credit Tableau de Bord 10. Credit Academy (1,200 credit officers, 1,000 risk managers) 3. Application processing system 5. Anomalies management system Small Businesses 7. Collection system Retail
HR SYSTEMS AND TRAINING COMMON HR SYSTEMS AND TRAININGS • Increase quality of first line managers • Develop second line talent pools, also via cross-border experiences • Develop the best performing commercial networks • top quality of branch managers and relationship managers (assessment centres / substitution) • training to pivotal positions and to local trainers • Develop best risk manager skills in the region • quality of credit officers and relationship managers • training to credit officers and to local trainers • Rejuvenating staff • turnover higher than “natural pace” to change mix and quality of resources • strong focus in selecting junior with high potential and internally train/grow them • Creation of NE Banking Academy for local trainers, senior management and pivotal jobs • Creation of NE Banking MBA
UCI’S NEW EUROPE STRATEGY BASED ON A CONSISTENT NEW EUROPE BUSINESS MODEL BOTH BY INTEGRATION OF ITS KEY COMPONENTS ... STRATEGY GOVERNANCE IT SYSTEMS ORGANIZATION HR SYSTEMS & TRAINING RISK SYSTEMS PRODUCT SHELF
... AND BY APPROPRIATE ADJUSTMENT OF THE NEW EUROPE BUSINESS MODEL TO THE LOCAL ENVIRONMENTS
AGENDA New Europe: Why and How Recent Results Strategy and Business Model Three Year Plan: the Targets Conclusions
NEW EUROPE DIVISION: STRATEGIC OBJECTIVES 2003-2006 • Clear N.1 Banking Group in New Europefor profitability, value creation, cost/income and for AUM (double digit market share) • Different strategic focus with: • “Leading Banks” in 3-4 countries: N.1 player in the market, focused on constant improvement of bottom line while maintaining market shares and fulfilling their institutional role within local communities • “Emerging Leaders” in 3-4 countries: banks focused on growth through enlargement of Golden Customer’s base (customer acquisition program) with final goal of being in the “top 5” in the market • Future growth driven mainly by organic growth (with some potential acquisitions) • Best risk manager in the New Europe region • Focus on building a long term sustainable franchise and on assuring higher customer loyalty, through a superior quality of services • Possible completion of geographic coverage in New Europe, also leveraging on “managerial hubs” (eg. Zaba, Pekao)
OUR 2006 FINANCIAL TARGETS ROAE % ROAA % 20.7 2.0 EVA (Euro mln) 13.44 1.25 221 461 2002 2006 2002 2006 Avg. Cost of Equity % Tier 1 Ratio % 2002 2006 17.2 14.6 14.2 14.2 11.9 RARORAC % 2002 2006 2002 2006 12.1 Avg. Allocated Capital Forward CoE taking into account EU convergence 4.92 (Euro mln) 1,832 9363 2002 2006 2002 2006 1 Euro 14 mln including KFS and Zivno (2006 perimeter) 4 14.9% excluding KFS and Zivno (2002 historical perimeter) 2 1.2% including KFS and Zivno (2006 perimeter) 5 1.4% excluding KFS and Zivno (2002 historical perimeter) 3 Euro 1,168 mln including KFS and Zivno (2006 perimeter)
Front Office Staff/ Tot. Staff2 67% 60% 2002 2006 OUR 2006 COMMERCIAL PERFORMANCE TARGETS VOLUMES (eop) CAGR 02-06 Gross Loans/Deposits 72.7% 58.4%1 Gross Loans 14.8% Deposits 8.7% AuM 44.0% 2002 2006 REVENUES CAGR 02-06 Active Customers2 (mln) 7.0 REVENUES CAGR 02-06: +8.8% 6.0 other Retail 11.3% Corporate 17.7% golden 20% 15% 2002 2006 Net Interest Income /Avg. Assets Branches2 3.9% 3.6% 1,628 1,3323 2002 2006 2002 2006 1 55.7% excluding KFS and Zivno (2002 historical perimeter) 2002 pro -forma, consistent with 2006 perimeter (including Zivno and KFS) 2 KFS is included at 100% 3 1,184 excluding KFS and Zivno (2002 historical perimeter) At current FX
OUR 2006 COST TARGETS COST/INCOME Operating Costs CAGR 02-06: 5.3% 51.6%1 Employees5 45.2% 31,0064 28,188 Staff Costs CAGR 02-06: 2.8% 2002 2006 2002 2006 Other costs3 CAGR 02-06: 6.1% DECREASING COST OF RISK: Net Provisions/ Net Loans (bp) 1892 158 Depreciation CAGR 02-06: 11.7% 2002 2006 1 49.5% excluding KFS and Zivno (2002 historical perimeter) 2002 pro -forma, consistent with 2006 perimeter (including Zivno and KFS) At current FX 2 335 bp including the impact of 2002 extraordinary provisions (Euro 168 mln) 3 Including deposits insurance and indirect taxes 5 KFS 100% 4 26,531 excluding KFS and Zivno (2002 historical perimeter)
AGENDA New Europe: Why and How Recent Results Strategy and Business Model Three Year Plan: the Targets Conclusions
UCI’S NEW EUROPE CHALLENGE: THE KEY POINTS WE HOPE WILL COME ACROSS • By and large the New Europe region will allow good growth for the banking activity • Developing this opportunity requires to forge and implement one of the first examples of truly cross border retail banking - where we need to strike the right balance between “McDonald-banking” and tailor-made “Boutique banking” • Are we succeeding? We think so. “Industrial” progresses are evident, financial results are positive. Poland’s environment could be much better - but maybe there we’ve just hit the rock bottom