Download

1 / 44
470 likes | 663 Views
Association Mining. Dr. Yan Liu Department of Biomedical, Industrial and Human Factors Engineering Wright State University. Introduction. What is Association Mining

E N D
Association Mining Dr. Yan Liu Department of Biomedical, Industrial and Human Factors Engineering Wright State University
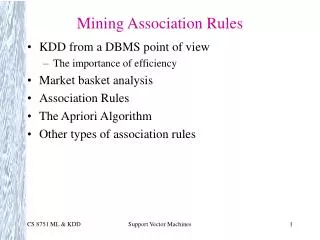
Introduction • What is Association Mining • Discovering frequent patterns, associations, correlations, or causal structures among sets of items or objects in transaction databases, relational databases, or other information repositories • Frequent patterns • Patterns (such as itemsets, subsequences, or substructures) that occur frequently • Motivation of Association Mining • Discovering regularities in data • What products are often purchased together? — Beer and diapers?! • What are the subsequent purchases after buying a PC? • What kinds of DNA are sensitive to this new drug? • Can we automatically classify web documents?
Association Rules: Basic Concepts • I={I1, …, In} is a set of items • D is the task-relevant dataset consisting of a set of transactions where each transaction T is a set of items such that • Association Rule • X Y, where X and Y are antecedent and consequent items, respectively • Support • Probability that a transaction contains both X and Y, i.e. P(XY) • P(X Y) = (# of transactions that contain both X and Y) / (total # of transactions) • Confidence • Probability that a transaction that contains Y also contains X, i.e. P(Y|X) • P(Y|X) = P(X Y) / P(X) = support (X Y) / support (X) • Mining Association Rules • Finding association rules that satisfy the minimum support and confidence thresholds
I={A, B, C, D, E, F} Min. support 50% Min. confidence 60% AC: support = 50% confidence = support(A C)/support(A)= 50% / 75% = 66.6%
Mining Association Rules • Goal • Discover rules with high support and confidence values • Two-Step Process • Find all frequent itemsets • Itemsets that occur at least as frequently as the predetermined minimum support • Generate strong association rules from the frequent itemsets • Generate rules that satisfy minimum support and minimum confidence • If we have all frequent itemsets, we can compute support and confidence!
Apriori Algorithm • Overview • First proposed by Agrawal and Srikant (1994) for mining Boolean association rules • Use prior knowledge of frequent itemset properties • Any subset of a frequent itemset must be frequent (why?) • e.g. if itemset{beer, diaper, nuts} is frequent, so is itemset {beer, diaper} • Aprioripruning principle: If there is anitemset is infrequent, its superset is also infrequent and thus should not be generated • Process of Generating Frequent Itemsets • Join step • Generate all candidate k-itemsets, Ck, by self-joining frequent (k-1)-itemsets, Lk-1 • e.g. L2={ac, bc, be} self-joining L2 x L2 : C3={abc, ace, abe, bce} • Prune step • A scan of the database to determine the count of each candidate in Ck to determine Lk • e.g. Pruning C3 gets L3={bce}. But{abc}, {ace}, {abe} are not frequent itemsets because {ab}, {ae}, and{ce} are not in L2
Apriori Algorithm Example Transaction Database C1 L1 1st Scan Self-Join C2 L2 2nd scan Self-Join 3rd scan C3 L3
Apriori Algorithm (Cont.) • Generating Association Rules from Frequent Itemsets • For each frequent k-itemset (k≥2), l, generate all nonempty proper subsets of l • For each nonempty subset of l, s, output the rule “s(l- s)” if the confidence of this rule satisfies the minimum confidence threshold, i.e. support_count (l) / support_count(s) ≥ minimum confidence
Improve Efficiency of Apriori • Challenge in Mining Frequent Itemsets • Multiple scans of transaction database are costly • Huge number of candidates • e.g. To find frequent itemset {i1,i2…,i100 }: # of scans: 100, # of Candidates: • Transaction Reduction • Reduce the number of transactions scanned in future iterations • A transaction that does not contain any frequent k-itemsets cannot contain any frequent (k+1)-itemsets and thus do not need to be considered in future scans
Improve Efficiency of Apriori (Cont.) • Partitioning • Need only two database scans to mine frequent itemsets • Scan 1: Divide database into non-overlapping partitions and find local frequent itemsets for each partition • Scan 2: Assess actual support of local frequent itemsets to determine global frequent patterns • Sampling • Randomly select a sample of the database and search for frequent itemset in the sample • Trade off accuracy against efficiency
Improve Efficiency of Apriori (Cont.) Transactions 1-itemsets 2-itemsets Apriori … 1-itemsets 2-itemsets DIC 3-itemsets • Dynamic Itemset Counting (DIC) • Database is divided into blocks marked by start points • New candidates can be added at any start point once all of their subsets are estimated to be frequent • In Apriori, new candidates are added only after a complete database scan
Frequency-Pattern (FP) Growth • Purpose • Find frequent itemsets without candidate generation • General Idea • Compress the database representing frequent items into a FP-tree which retains the itemset association information • Mine the FP-tree to find frequent itemsets • Construct FP-Tree • 1st scan of the database: derive the set of frequent items and their support counts; sort the frequent items in the order of descending support count (the resulting list is denoted L) • Create the root of the tree, labeled “null” • 2nd scan of the database: the items in each transaction are processed in L order , and a branch is created for each transaction • Braches that with share a common prefix are combined • To facilitate tree traversal, an item header table is built so that each item points to its occurrences in the tree via a chain of node-links
FP-Tree Growth Example (ordered) frequent items {f, c, a, m, p} {f, c, a, b, m} {f, b} {c, b, p} {f, c, a, m, p} c:1 b:1 b:1 p:1 Minimum support count is 2. L: {{f: 4}, {c: 4}, {a: 3}, {b: 3}, {m:3}, {p: 3}} {} {} {} TID items bought T1+T2+T3 T2 {} T4 T1+T2 T3 T5 (root) 1 {f, a, c, d, g, i, m, p} 2 {a, b, c, f, l, m, o} 3 {b, f, h, j, o, w} 4 {b, c, k, s, p} 5 {a, f, c, e, l, p, m, n} T1 f:1 f:1 f:1 f:4 f:3 f:2 f:1 c:1 b:1 c:1 c:1 c:3 c:2 c:2 c:1 b:1 b:1 a:1 a:3 a:2 a:1 a:2 a:1 p:1 b:1 m:1 m:2 m:1 m:1 m:1 b:1 b:1 b:1 m:1 p:1 p:2 p:1 p:1 m:1 m:1 m:1 p:1
{} Header Table Item Frequency f 4 c 4 a 3 b 3 m 3 p 3 f:4 c:1 c:3 b:1 b:1 a:3 p:1 m:2 b:1 p:2 m:1 FP-Tree Registers Compressed Frequent Pattern Information
Frequency-Pattern (FP) Growth (Cont.) • Mine Frequent Itemsets from FP-Tree • Starting from the last item in the header table, for each frequent item, construct its conditional pattern-base, and then its conditional FP-tree • Conditional pattern-base of an item consists of the set of its prefix paths in the FP-tree co-occurring with the suffix pattern • Repeat the process on each newly created conditional FP-tree • Until the resulting conditional FP-tree is empty, or it contains only one path—single path will generate all the combinations of its sub-paths, each of which is a frequent pattern
{} f:4 c:1 c:3 b:1 b:1 a:3 p:1 m:2 b:1 p:2 m:1 FP-Tree Growth Example (Cont.) <f, c, a, m, p: 2>, <c, b, p: 1> Considering p as suffix <f, c, a, m: 2>, <c, b: 1> Conditional Pattern Base <f: 2, c: 2, a: 2, m: 2>, <c: 1> Conditional FP-Tree {f,p:2}, {c,p:3}, {a,p:2}, {m,p:2} {f,c,p:2}, {f,a,p:2}, {f,m,p:2}, {c,a,p:2}, {c,m,p:2}, {a,m,p:2} {f,c,a,p:2}, {c,a,m,p:2} {f,c,a,m,p:2} Frequent itemsets • Traverse the FP-tree by following the link of each frequent item p • Accumulate all of transformed prefix paths of item p to form p’s conditional pattern base • Construct conditional FP-tree by eliminating non-frequent items • Concatenate items in conditional FP-tree with p to generate frequent itemsets with p
Advantages of FP-Growth over Apriori • Divide-and-Conquer • Decompose both the mining task and database according to the frequent patterns obtained so far • Leads to focused search of smaller dataset • Other Factors • No candidate generation, no candidate test • Compressed database: FP-tree structure • No repeated scan of entire database • Basic operation — counting local frequent items and building sub FP-tree, no pattern search and matching
Mining Various Kinds of Rules or Regularities • Multi-Level Association Rules • Involve concepts at different levels of abstraction • Multi-Dimensional Association Rules • Involve more than one antecedent • Quantitative Association Rules • Involve numeric attributes that have an implicit ordering among values
Mining Multi-Level Association Rules • Mining Multi-Level Hierarchy • Top-down strategy • Starting from the top level in the hierarchy and working downward in the hierarchy toward the more specific concept levels • For each level frequent itemsets and association rules are mined • Variations of Support Threshold • Uniform minimum support threshold for all levels • The same minimum support threshold is used for all levels • Reduced minimum support threshold at lower levels • Lower-level items usually have lower support • Group-based minimum support threshold • Users or experts set up user-specific item- or group-based minimum support threshold
Uniform support Reduced support Level 1 min_sup = 5% Level 1 min_sup = 5% Milk [support = 10%] Level 2 min_sup = 5% 2% Milk [support = 6%] Skim Milk [support = 4%] Level 2 min_sup = 3%
Mining Multi-Level Association Rules (Cont.) • Rule Redundancy • Some rules may be redundant due to “ancestor” relationships between items • A rule is redundant if its support is close to the “expected” value, based on the rule’s ancestor • e.g. milk is the “ancestor” of “2% milk” • Suppose Rule 1: milk wheat bread [support = 8%, confidence = 70%] • and we know that about ¼ of the milk is 2% milk • If Rule 2: 2% milk wheat bread [support = 2%, confidence = 72%], then rule 2 is redundant
Mining Multi-Dimensional Association Rules • Single-Dimensional Rules • e.g. buys(X, “milk”) buys(X, “bread”) • Multi-Dimensional Rules: 2 antecedents • Inter-dimension assoc. rules (no variable appear in both antecedent and consequent) e.g. age(X, “19-25”) occupation(X,“student”) buys(X,“coke”) • Hybrid-dimension assoc. rules (variables can appear in both antecedent and consequent) e.g. age(X,”19-25”) buys(X, “popcorn”) buys(X, “coke”) • Categorical Attributes • Finite number of possible values, no ordering among values • Quantitative Attributes • Numeric, implicit ordering among values
Mining Multi-Dimensional Association Rules (Cont.) • Static Discretization • Quantitative attributes are discretized using predefined concept hierarchies (static discretization) • e.g. Values of attribute age can be discretized into intervals “0… 20K”, “21K… 30K”, “31K… 40K”, … • Dynamic Discretization • Quantitative attributes are discretized or clustered into “bins” based on data distribution • Treats numeric attribute values as quantities rather than predefined ranges or categories
Static Discretization of Quantitative Attributes • Quantitative attributes are discretized prior to mining using predefined concept hierarchies • Numeric values are replaced by intervals • Data cube is well suited for mining multi-dimensional association rules • The cells of an k-dimensional cuboid correspond to the itemsets • Store aggregates (such as support counts) in multi-dimensional space
(income) (age) (buys) (age,buys) (income,buys) (age,income) (age,income,buys) 0 0-D cuboid 1-D cuboids 2-D cuboids 3-D cuboid 3D Data Cube (each cuboid representing an item or itemset)
Quantitative Association Rules • Numeric attributes are dynamicallydiscretized to satisfy some mining criteria • Such that maximizing the confidence or compactness of the rules mined • 2-D Quantitative Association Rules • Aquan1 Aquan2 Acat • Aquan1and Aquan2 are two quantitative predicate attribute intervals (determined dynamically) • Acatis a categorical attribute • e.g. age(X, “30…39”) income(X, “42K…48K”) buys(X, “HDTV”) • Association Rule Clustering System • Map “adjacent” association rules to form general rules using a 2-D grid • Search the grid for clusters of points from which the association rules are generated
Quantitative Association Rules • Numeric attributes are dynamicallydiscretized to satisfy some mining criteria • Such that maximizing the confidence or compactness of the rules mined • 2-D Quantitative Association Rules • Aquan1 Aquan2 Acat • Aquan1and Aquan2 are two quantitative predicate attribute intervals (determined dynamically) • Acatis a categorical attribute • e.g. age(X, “30…39”) income(X, “42K…48K”) buys(X, “HDTV”) • Association Rule Clustering System • Map “adjacent” association rules to form general rules using a 2-D grid • Search the grid for clusters of points from which the association rules are generated
Association Rule Clustering System • Step 1: Binning • Partition the ranges of quantitative attributes into intervals • Equal-width binning • The interval size of each bin is the same • Equal-frequency binning • Each bin has approximately the same number of records • Clustering-based binning • Clustering is performed on the quantitative attribute to group neighboring points in to the same bin
Association Rule Clustering System (Cont.) • Step 2: Finding Frequent Predicate Sets • Once the 2-D array containing the count distribution for each category is set up, it can be scanned to find the frequent predicate sets (i.e. those satisfying minimum support) that also satisfy minimum confidence • Use the rule algorithm generation algorithm (such as Apriori) discussed before • Step 3: Clustering Association Rules • Strong association rules obtained in the previous step are mapped to a 2-D grid • age(X, “34”) income(X, “30K-40K”) buys(X, “HDTV”) • age(X, “34”) income(X, “40K-50K”) buys(X, “HDTV”) • age(X, “35”) income(X, “30K-40K”) buys(X, “HDTV”) • age(X, “35”) income(X, “40K-50K”) buys(X, “HDTV”) Combined into age(X, “34-35”) income(X, “30K-50K”) buys(X, “HDTV”)
play basketball eat cereal, support = ? Confidence = ? Support = 2000/5000 = 40% Confidence = 2000/3000 = 66.7% The overall percentage of students eating cereal (regardless basketball play) is 3750/5000 = 75% > 66.7%, so rule play basketball eat cereal is misleading • play basketball noteat cereal, support = ? Confidence = ? Support = 1000/5000 = 20% Confidence = 1000/3000 = 33.3% The overall percentage of students not eating cereal (regardless basketball play) is 1250/5000 = 25% < 33.3%, so rule play basketball noteat cereal is more accurate than play basketball eat cereal
Correlation Analysis • play basketball eat cereal, support = ? Confidence = ? Support = 2000/5000 = 40% Confidence = 2000/3750 = 66.7% The overall percentage of students eating cereal (regardless basketball play) is 3750/5000 = 75% > 66.7%, so rule play basketball eat cereal is misleading • play basketball noteat cereal, support = ? Confidence = ? Support = 1000/5000 = 20% Confidence = 1000/3000 = 33.3% The overall percentage of students not eating cereal (regardless basketball play) is 1250/5000 = 25% < 33.3%, so rule play basketball noteat cereal is more accurate than play basketball eat cereal
Correlation Analysis (Cont.) • Why Correlation Analysis • Support and confidence measures can be insufficient in filtering out uninteresting association rules • Correlation measures can augment the support-confidence framework for association rules • Lift • χ2 analysis • All_confidence • Cosine
Lift • If lift(A, B) < 1, then occurrence of A is negatively correlated with the occurrence of B • If lift(A, B) > 1, then occurrence of A is positively correlated with the occurrence of B • If lift(A, B) = 1, then occurrences of A and B are independent • If occurrence of A is independent of occurrence of B if P(A and B) = P(A)P(B)
play basketball eat cereal, lift= ? • play basketball not eat cereal, lift= ? P(play basketballand eat cereal) = 2000/5000 = 40% P(play basketball) = 3000/5000 = 60% P(eat cereal) = 3750/5000 = 75% lift(play basketball , eat cereal) = 40%/(60%*75%) = 0.889 P(play basketballand not eat cereal) = 1000/5000 = 20% P(not eat cereal) = 1250/5000 = 25% lift(play basketball , eat cereal) = 20%/(60%*25%) = 1.33 In conclusion, playing basketball and eating cereal are negatively correlated!
χ2Analysis = 277.78 >> χ2 0.05(1) = 3.84 • playing basketball and eating cereal are NOT independent • Observed the value of (basketball, Cereal) is less than the expected value of (basketball, Cereal), so playing basketball and eating cereal are negatively correlated
All_Confidence Given an itemset X={i1, i2, …, ik}, the all_confidence of X is defined as where is the maximum single item support for all the items in X all_confidenceof X is the minimal confidence among the set of rules ij → X-ij, where • if X={A, B}, whenall_conf(X) > 0.5, A and B are positively correlated; when all_conf(X) = 0.5, A and B are independent; when all_conf(X) < 0.5, A and B are negatively correlated X = {basketball, cereal} sup(X) = 2000/5000 = 40% max{sup(ij)} = max{3000/5000, 3750/5000} = 3750/5000 = 75% all_conf (X) = 40%/75% = 53.3%
cosine Measure Given two itemsetsA and B, the cosine measure of A and B is defined as cosine (A, B) • cosine (A, B) > 0.5, A and B are positively correlated; cosine (A, B) = 0.5, A and B are independent; cosine (A, B) < 0.5, A and B are negatively correlated • cosine measure can be viewed as a harmonized lift measure: the square root is taken on P(A) x P(B), so that the cosine value is only influenced by sup(A) and sup(B), not by the number of transactions A = {basketball}, B = {cereal} sup(A) = 3000/5000 , sup(B) = 3750/5000, sup(A and B) = 2000/5000 cosine(A, B) = 2000/(√3000*3750) = 59.6%
Comparison of Four Correlation Measures • lift and χ2 are poor indicators because they are greatly affected by the null transaction • all_conf and cosine are better indicators because they are not affected by the null transaction • cosine is better when ~mc and m~c are unbalanced • Null-invariance (free of the influence of null transactions) is an important property for measuring correlations in large transaction databases
Comparison of Four Correlation Measures (Cont.) • lift and χ2 show correlation between g and v changes from being rather positive to rather negative • all_conf and cosine cannot precisely assert positive/negative correlations when they are around 0.50 Rule of Thumb: in large transaction databases, perform the all_conf or cosine analysisfirst, and when the result shows that they are weakly positively/negatively correlated, lift or χ2 can be used to assist analysis
Constraint-Based Data Mining • Problems of Automatic Data Mining • The derived patterns can be too many but not focused • Users lack understanding of the derived patterns • Users’ domain knowledge cannot be taken advantage of • Interactive Data Mining • Users direct data mining process through queries or graphical user interfaces • Constraint-Based Mining • Users specify constraintson what “kinds” of patterns to be mined • Knowledge type constraints • Specify the type of knowledge to be mined (e.g. association, classification rules) • Data constraints • Specify the set of task-relevant data • Dimension/level constraints • Specify the desired dimensions (or attributes) of the data, or levels of the concept hierarchies, to be used in mining • Interestingness constraints • Specify thresholds on statistical measures of interestingness of patterns (e.g. support, confidence, correlation of association rules) • Rule constraints • Specify the forms of rules to be mined
Metarule-Guided Association Rules Mining • Metarules • Specify the syntactic form of rules that users are interested in mining • Rule forms are used as constraints to help improve efficiency of the mining process e.g. You are interested in finding associations between customer traits and the items they purchase. However, rather than finding all the association rules that reflect these relationships, you are particularly interested in determining which pairs of customer traits promote the sale of office software. Metarule: P1(X, Y) P2(X, W) buys(X, “office software”) P1, P2: predicate variables that instantiated to some attributes from the database during mining X: a variable representing a customer Y, W: values of attributes assigned to P1 and P2, respectively age(X, “30..39”) income(X, “41K..60K”) buys(X, “office software”)