Download
1 / 21
210 likes | 330 Views
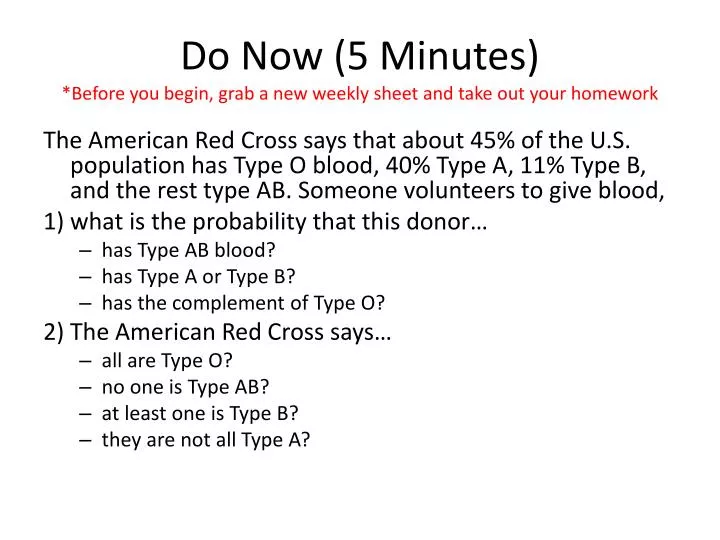
Do Now (5 Minutes) *Before you begin, grab a new weekly sheet and take out your homework. The American Red Cross says that about 45% of the U.S. population has Type O blood, 40% Type A, 11% Type B, and the rest type AB. Someone volunteers to give blood,

E N D
Do Now (5 Minutes) *Before you begin, grab a new weekly sheet and take out your homework The American Red Cross says that about 45% of the U.S. population has Type O blood, 40% Type A, 11% Type B, and the rest type AB. Someone volunteers to give blood, 1) what is the probability that this donor… • has Type AB blood? • has Type A or Type B? • has the complement of Type O? 2) The American Red Cross says… • all are Type O? • no one is Type AB? • at least one is Type B? • they are not all Type A?
Agenda • Review Do Now • Review Homework • Lesson on Applications of Probability • Practice Problems
Two-Way Tables • Can be used to find specific probabilities.
Example 1: Probability and Two-Way Tables Stu Staff Total American 107 105 212 European 33 12 45 Asian 55 47 102 Total 195 164 359 What is the probability that the driver is a student?
Example 1: Probability and Two-Way Tables Stu Staff Total American 107 105 212 European 33 12 45 Asian 55 47 102 Total 195 164 359 What is the probability that the driver drives a European car?
Example 1: Probability and Two-Way Tables Stu Staff Total American 107 105 212 European 33 12 45 Asian 55 47 102 Total 195 164 359 What is the probability that the driver drives an American or Asian car?
Example 1: Probability and Two-Way Tables Stu Staff Total American 107 105 212 European 33 12 45 Asian 55 47 102 Total 195 164 359 What is the probability that the driver is staff or drives an Asian car?
Example 1: Probability and Two-Way Tables Stu Staff Total American 107 105 212 European 33 12 45 Asian 55 47 102 Total 195 164 359 What is the probability that the driver is staff and drives an Asian car?
Example 1: Probability and Two-Way Tables Stu Staff Total American 107 105 212 European 33 12 45 Asian 55 47 102 Total 195 164 359 If the driver is a student, what is the probability that they drive an American car?
Example 1: Probability and Two-Way Tables Stu Staff Total American 107 105 212 European 33 12 45 Asian 55 47 102 Total 195 164 359 What is the probability that the driver is a student if the driver drives a European car?
Quick Check • Try the problem on your paper!
Tree Diagrams • Can be used to find all possible outcomes of an event. • Can be used to find the probabilities of specific outcomes as well.
Example 1: Probability and Tree Diagrams • If I roll two dice, what are the possible outcomes that I could receive? • Out of these possible outcomes, in how many cases could I get all heads?
Example 2: Probability and Tree Diagrams • A manufacturing firm orders computer chips from three different companies: 10% from Company A; 20% from Company B; and 70% from Company C. Some of the computer chips that are ordered are defective: 4% of chips from Company A are defective; 2% of chips from Company B are defective; and 0.5% of chips from Company C are defective. A worker at the manufacturing firm discovers that a randomly selected computer chip is defective. What is the probability that the computer chip came from Company B? Show your work.
Quick Check • Try the probability problem on your paper!
Venn Diagrams • Venn Diagrams can also be used to identify the relationships between probabilities
Example 1 According to the American Pet Products Manufacturers Association (APPMA) 2003-2004 National Pet Owners Survey, 39% of U.S. households own at least one dog and 34% of U.S. households own at least one cat. Assume that 60% of U.S. households own a cat or a dog. • What is the probability that a randomly selected U.S. household owns neither a cat nor a dog? • What is the probability that a randomly selected U.S. household owns both a cat and a dog? • What is the probability that a randomly selected U.S. household owns a cat if the household has a dog?
Classwork Assignment • Worksheet
Homework • Finish In-Class Assignment • Work on Project