1 / 7

Faculty by Age Cohort

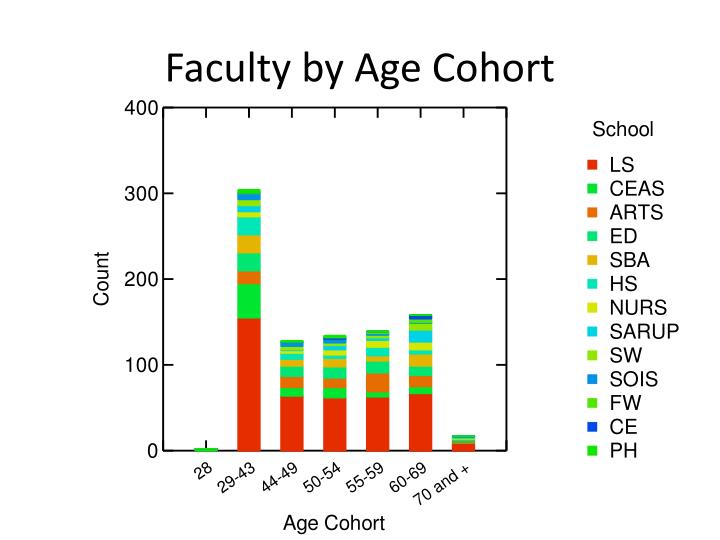
Faculty by Age Cohort. 350. 300. LS. 250. ARTS. ED. 200. HSCI. Count. SBA. 150. NURS. SW. 100. SOIS. ACADAFF. 50. CE. CEAS. 0. SARUP. 60-69. 70-+. 22-28. 29-43. 44-49. 50-54. 55-59. Age Cohort. Instructional Academic Staff by Age. 350. School. 300. LS. 250. ARTS.

uma
Download Presentation

Faculty by Age Cohort

An Image/Link below is provided (as is) to download presentation Download Policy: Content on the Website is provided to you AS IS for your information and personal use and may not be sold / licensed / shared on other websites without getting consent from its author. Content is provided to you AS IS for your information and personal use only. Download presentation by click this link. While downloading, if for some reason you are not able to download a presentation, the publisher may have deleted the file from their server. During download, if you can't get a presentation, the file might be deleted by the publisher.

E N D

Presentation Transcript


  1. Faculty by Age Cohort

  2. 350 300 LS 250 ARTS ED 200 HSCI Count SBA 150 NURS SW 100 SOIS ACADAFF 50 CE CEAS 0 SARUP 60-69 70-+ 22-28 29-43 44-49 50-54 55-59 Age Cohort Instructional Academic Staff by Age

  3. 350 School 300 LS 250 ARTS ED 200 HSCI Count SBA 150 NURS SW 100 SOIS ACADAFF 50 CE CEAS 0 SARUP 60-69 70-+ 22-28 29-43 44-49 50-54 55-59 Age Cohort Faculty and IAS Compared Instructional Academic Staff Faculty

  4. Faculty by School by Age

  5. Instructional Academic Staff by School College by Age

  6. Faculty Size by School

  7. Instructional Academic Staff Size by School/College

More Related