Download
1 / 10
100 likes | 110 Views
<br>Information collected in support of this study was collected through a combination of<br>primary and secondary research methods. Primary data sources included phone based<br>interviews with City staff, in order to acquire and verify/benchmark pipe data. Due to the potentially sensitive nature of the requested data, BCC initiated its data search using secondary sources

E N D
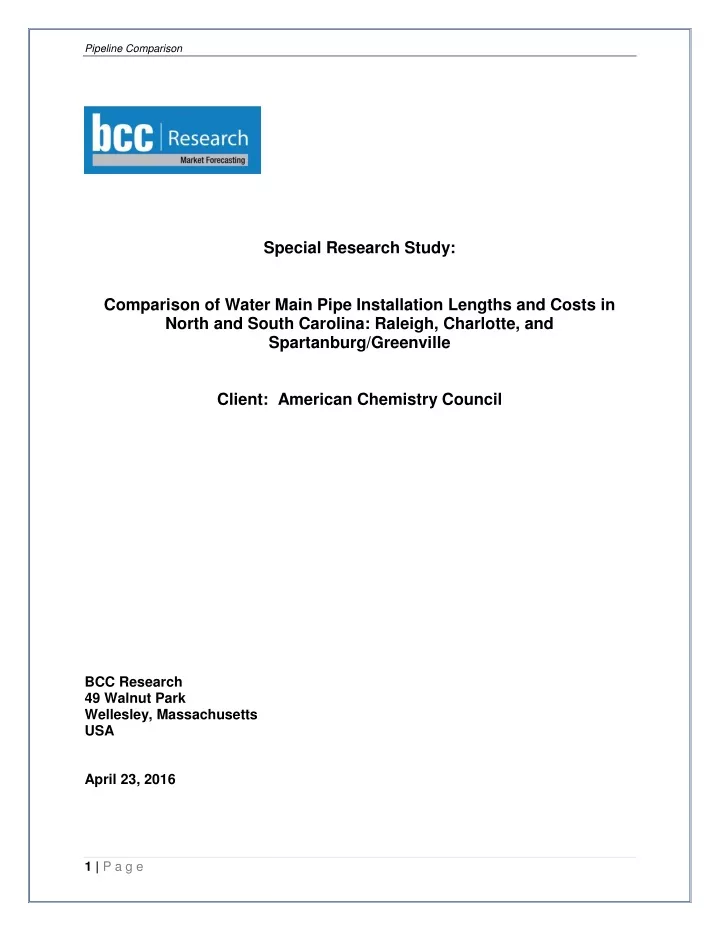
Pipeline Comparison Special Research Study: Comparison of Water Main Pipe Installation Lengths and Costs in North and South Carolina: Raleigh, Charlotte, and Spartanburg/Greenville Client: American Chemistry Council BCC Research 49 Walnut Park Wellesley, Massachusetts USA April 23, 2016 1 | P a g e
Pipeline Comparison INTRODUCTION PURPOSE The primary objective of this study was to provide a comparison of water distribution and transmission (pressurized) pipe installation and costs between three communities in North and South Carolina: one allowing open competition for pipe materials (Charlotte), and two that use a closed competition process for pipe materials and pipeline projects. Data gathered will help the Client to better understand: How much pipe is installed each year Pipe sizing Pipe material, where data are available Pipe cost and cost differential between communities that do and do not allow open bidding METHODOLOGY Information collected in support of this study was collected through a combination of primary and secondary research methods. Primary data sources included phone based interviews with City staff, in order to acquire and verify/benchmark pipe data. Due to the potentially sensitive nature of the requested data, BCC initiated its data search using secondary sources. For these cities, most of the data collected was based on secondary sources including bid and bid award notices, council meeting minutes, contracts, planning documents, water master plans, and other available documentation that may contain information on pipe installation lengths, sizes, and schedules. BCC collected public data that included pipe lengths, materials, diameter, and published costs. However, most data sources also included extraneous information and costs, above and beyond simple pipe cost. For example, most pipeline projects are bid out as a cost for construction and completion of the entire project, including pipe as well as appurtenances (valves, fire hydrants) and also roadwork and earthwork (pavement, fill, sidewalks, etc.). Extracting pipe costs from overall costs presented a challenge for some of the data we collected, because, pipe costs were not broken out explicitly in every instance. OVERALL ASSUMPTIONS & ENGINEERING MODELING FOR LARGER DIAMETERS For these projects, BCC developed an estimation tool to evaluate pipe costs based on total construction costs. The tool compares pipe costs to total installation costs, assuming in-road construction in an urban area, based on pipe diameter, using data collected as well as available engineering and cost estimation data (Figure 1). Average cost differential between each community was calculated based on differences in pipe costs among the three communities. Data for 6-inch and 8-inch pipe was the most readily available, depending on the city in question, and provided convenient and stable 2 | P a g e
Pipeline Comparison average cost values for comparison. Therefore, to minimize variability and more closely reflect real world pricing conditions, we calculated the overall cost differential among the cities based on cost differential of 6”, 8” or 12”, and where data were available, 20” pipe diameters. We then extrapolated to the other size/cost categories by typical price increases for each diameter category. Typical price increases by diameter were based on engineering cost estimation data available to the analyst, as well as other data collected in support of this study. Pipe diameter data were available for all projects in Charlotte, and for approximately 40 to 60% of all projects identified in other cities. Where no data were available, pipe diameter was estimated based on average available diameter data for installed pipe in that city. 3 | P a g e
Pipeline Comparison CITY OF CHARLOTTE (OPEN COMPETITION) PIPELINE INSTALLATION AND COST DATA Charlotte, North Carolina allows open competition for pipeline projects. The vast majority of the city’s in-ground water supply pipeline infrastructure is ductile iron. However, based on data collected in support of this project, the city over the last several years has been increasingly deploying plastic pipe for water supply mains within its service area. Data for the City were collected primarily based on filed bid responses and awarded contracts for City pipeline projects, which were publicly available in City Council meeting packages, through contract documentation, and as data made available to BCC research. Data collected were benchmarked against capital improvement projects (CIPs) identified in the City’s strategic operating plan (SOP). Pipeline diameter, length, and cost data were readily available for Charlotte for all identified projects. Table 1 summarizes the length and diameter of pipelines installed in Charlotte during 2013, 2014, and 2015. Similarly, Table 2 summarizes total pipe costs by diameter and year, while Table 3 summarizes pipeline cost per foot, and Table 4 summarizes pipe materials by length of pipe installed. Finally, we estimated typical pipe costs for Charlotte over the study period by diameter. These are shown in Table 5. Table 1: Charlotte, NC: Linear Feet of Pipe Installed, 2013-2015 Pipe Length Installed per Year (feet) Pipe Diameter (Inches) 2013 2014 2015 4" to 6" - 8,546 16,900 8" to 12" 570 6,550 12,900 Over 12" - 13,432 8,000 Total 570 28,528 37,800 Source: BCC Research and City of Charlotte, NC. Table 2: Charlotte, NC: Pipeline Cost, 2013-2015 Pipe Cost, Total per Year Pipe Diameter (Inches) 2013 2014 2015 (est.) 4" to 6" $- $183,727 $374,325 8" to 12" $15,005 $184,760 $324,800 Over 12" $- $2,110,409 $526,975 Total $15,005 $2,478,896 $1,226,100 Source: BCC Research and City of Charlotte, NC. 4 | P a g e
Pipeline Comparison Table 3: Charlotte, NC: Pipe Cost per Foot Pipe Cost, Average per Foot Pipe Diameter (Inches) 2013 2014 2015 (est.) 4" to 6" - $ 21.50 $ 22.15 8" to 12" $ 26.32 $ 28.21 $ 25.18 Over 12" - $ 157.12 $ 65.87 Source: BCC Research and City of Charlotte, NC. Table 4: Charlotte, NC: Pipe Materials Pipe Length Installed Pipe Materials 2013 2014 2015 Ductile Iron 0 44,631 22,900 Plastics 570 7,450 25,350 Total 570 52,081 48,250 Source: BCC Research and City of Charlotte, NC. Table 5: Charlotte, NC: Estimated Average Pipe Cost, by Pipe Diameter Estimated Average Cost per Foot Diameter (Inches) 4 $ 14.73 6 $ 21.93 8 $ 26.20 10 $ 32.39 12 $ 36.54 14 $ 43.29 16 $ 48.89 18 $ 65.13 20 $ 71.34 $ 151.90 24 Source: BCC Research and City of Charlotte, NC. 5 | P a g e
Pipeline Comparison CITY OF RALEIGH (CLOSED COMPETITION) PIPELINE INSTALLATION AND COST DATA Raleigh, North Carolina maintains a closed material competition process for pipeline projects, strongly focusing on ductile iron as the main water supply/pressure main pipe material. All pipeline project data collected for which pipe material information was available indicated that ductile iron was used. No projects that used plastic pipelines were identified within the City of Raleigh, although materials for several projects were not available. Because we could find no evidence of plastic pipe installed for water mains in the City, we concluded projects with unidentified pipe materials used ductile iron. Note that pipeline project cost was calculated separately from estimates of pipe material costs; pipeline project cost does not consider pipe material, but is instead calculated based on average cost by diameter, as described above. Data for the City were collected 1) based on City bid response records and awarded contracts for City pipeline projects, which were publicly available in City Council meeting packages, 2) through contract documentation, and 3) as data made available to BCC research. Where applicable, data collected were benchmarked against data and projections contained in the City’s 2015-2019 Capital Improvement Program. Table 6 summarizes the length and diameter of pipe installed in Raleigh during 2013, 2014, and 2015. Similarly, Table 7 summarizes total pipe project costs by diameter and year, while Table 8 summarizes pipe cost per foot, and Table 9 summarizes pipe materials by length of pipe installed. Finally, we estimated typical pipe costs for Raleigh over the study period as a function of diameter. These are shown in Table 10. Table 6: Raleigh, NC: Linear Feet of Pipe Installed, 2013-2015 Pipe Length Installed per Year (feet) Pipe Diameter (Inches) 2013 2014 2015 4" to 6" 2,216 4,431 3,903 8" to 12" 15,509 19,201 24,017 Over 12" 739 985 2,101 Total 18,463 24,617 30,021 Source: BCC Research and City of Raleigh, NC. 6 | P a g e
Pipeline Comparison Table 7: Raleigh, NC: Pipe Cost, 2013-2015 Pipe Cost, Total per Year Pipe Diameter (Inches) 2013 2014 2015 (est.) 4" to 6" $65,959 $131,918 $ 116,188 8" to 12" $895,394 $ 1,108,584 $1,386,596 Over 12" $93,870 $125,160 $ 267,111 Total $1,055,224 $1,365,662 $ 1,769,895 Source: BCC Research and Raleigh, NC. Table 8: Raleigh, NC: Pipe Cost per Foot, 2013-205 Pipe Cost, Average per Foot Pipe Diameter (Inches) 2013 2014 2015 (est.) 4" to 6" $ 29.77 $ 29.77 $ 29.77 8" to 12" $ 57.73 $ 57.73 $ 57.73 Over 12" $ 127.11 $ 127.11 $ 127.11 Source: BCC Research and Raleigh, NC. Table 9: Raleigh, NC: Pipe Materials, 2013-2015 Pipe Length Installed Pipe Materials 2013 2014 2015 Ductile Iron 18,463 24,617 30,021 Plastics - - - Total 18,463 24,617 30,021 Source: BCC Research and Raleigh, NC. Table 10: Raleigh, NC: Estimated Average Pipe Cost, by Pipe Diameter Diameter (Inches) Estimated Average Cost per Foot 4 $ 26.24 6 $ 29.77 8 $ 46.69 10 $ 57.71 12 $ 65.10 14 $ 77.13 16 $ 116.04 18 $ 116.04 20 $ 127.11 Source: BCC Research and Raleigh, NC. 7 | P a g e
Pipeline Comparison CITIES OF SPARTANBURG/GREENVILLE (CLOSED COMPETITION) PIPELINE INSTALLATION AND COST DATA The Cities of Spartanburg and Greenville, South Carolina, maintain closed competition processes for pipeline projects, strongly focusing on ductile iron as the main water supply/pressure main pipe material. The vast majority of pipeline project data collected in support of this study indicated that ductile iron was used, rather than plastics. In total, the Cities collectively installed approximately 1% to 3% of all pipe as plastic during 2013 to 2015, in comparison to 97% to 99% ductile iron. Materials data were not available for every pipeline project identified. Therefore, we assumed that projects with unknown materials included a similar proportion of ductile iron versus plastic as identified for projects with available materials data. Note that pipe cost was calculated separately from estimates of pipe material; pipe cost does not consider pipe material, but is instead calculated based on average cost by diameter, as described previously. Data for the Cities were collected based on project documentation for awarded City pipeline projects, which were publicly available, and through City meeting minutes and agendas. Bid dates and other information were available through Greenville’s Water Main Status Reports, which did not identify cost, but nonetheless helped to identify/match bid responses for specific projects and therefore helped to identify cost and pipe diameter using other available information. Data collected were benchmarked against documented changes in total water main pipeline length managed by the City (Greenville), updated on an annual basis. Table 11 summarizes the length and diameter of pipe installed in Spartanburg/Greenville, SC during 2013, 2014, and 2015. Similarly, Table 12 summarizes total pipe costs by diameter and year, while Table 13 summarizes pipe cost per foot, and Table 14 summarizes pipe materials by length of pipe installed. Finally, we estimated typical pipe costs for Spartanburg/Greenville, SC over the study period as a function of diameter. These are shown in Table 15. Table 11: Spartanburg/Greenville, SC: Linear Feet of Pipe Installed, 2013-2015 Pipe Length Installed per Year (feet) Pipe Diameter (Inches) 2013 2014 2015 4" to 6" 71,965 9,775 121,623 8" to 12" 39,204 5,325 62,933 Over 12" - 2,050 887 Total 111,169 17,150 185,443 Source: BCC Research and Cities of Spartanburg and Greenville, SC. 8 | P a g e
Pipeline Comparison Table 12: Spartanburg/Greenville, SC: Pipe Cost, 2013-2015 Pipe Cost, Total per Year Pipe Diameter (Inches) 2013 2014 2015 (est.) 4" to 6" $ 1,437,542 $195,263 $2,429,483 8" to 12" $ 1,343,352 $182,469 $2,119,353 Over 12" $- $297,612 $ 75,648 Total $2,780,894 $675,344 $ 4,624,484 Source: BCC Research and Cities of Spartanburg and Greenville, SC. Table 13: Spartanburg/Greenville, SC: Pipe Cost per Foot Pipe Cost, Average per Foot Pipe Diameter (Inches) 2013 2014 2015 (est.) 4" to 6" $ 19.98 $ 19.98 $ 19.98 8" to 12" $ 34.27 $ 34.27 $ 33.68 $ 145.18 Greater than 12" to 20” Source: BCC Research and Cities of Spartanburg and Greenville, SC. Table 14: Spartanburg/Greenville, SC: Pipe Materials - $ 85.28 Pipe Length Installed Pipe Materials 2013 2014 2015 Ductile Iron 108,701 12,550 182,842 Plastics 2,468 4,600 2,601 Total 111,169 17,150 185,443 Source: BCC Research and Cities of Spartanburg and Greenville, SC. Table 15: Spartanburg/Greenville, SC: Estimated Average Pipe Cost, by Pipe Diameter Diameter (Inches) Estimated Average Cost per Foot 4 $ 17.61 6 $ 19.98 8 $ 31.33 10 $ 38.72 12 $ 43.68 14 $ 51.75 16 $ 70.88 18 $ 77.86 20 $ 85.28 Source: BCC Research and Cities of Spartanburg and Greenville, SC. 9 | P a g e
Pipeline Comparison SUMMARY FINDINGS AND CONCLUSIONS Key findings of this project indicate that the City of Charlotte, which does not restrict pipe competition to a particular material as long as pipe materials meet City specifications, enjoys the lowest cost, on average, for pipeline capital costs. Raleigh, which restricts water pipe materials to ductile iron, received and accepted bids having a higher average pipe cost than those located in Charlotte, for all pipe sizes except for 6” in Spartanburg/Greenville. Pipe costs (not including road improvements or other appurtenances) in Raleigh were, on average across all pipe diameters, 80% higher than in Charlotte, while pipe costs in Spartanburg/Greenville were, on average, 19% higher than in Charlotte. Pipe costs were higher in Spartanburg/Greenville than Charlotte for all pipe diameters except 6”, where Spartanburg/Greenville’s cost was 8.9% lower than Charlotte’s. Based on 2014 data, pipe capital costs in Raleigh were found to be $304,800 per mile ($57.73 per foot) for 8” to 12” diameter pipe, compared to $148,900 per mile ($28.21 per foot) on average in Charlotte. Thus per-mile costs were, on average, $155,900 higher in Raleigh than in Charlotte, for 8” to 12” diameter pipe in 2014. This is equivalent to a cost savings of $29.53 per foot, or over 50% on average for Charlotte in comparison to Raleigh. Based on these averages, Charlotte would save nearly $1.6 million on the installation of 10 miles of pipeline, in comparison to Raleigh. Last, we were also able to use the data collected to compare 8” ductile iron pipe cost for Raleigh – $46.69/foot –to 8” ductile iron pipe cost for Charlotte – $30.08/foot. Therefore, even for ductile iron alone, 8” pipe costs in Charlotte were found to be over $16 per foot lower than Raleigh, equivalent to a pipe capital cost savings of 36%. Cost per Foot by Municipality Charlotte pipe cost Raleigh Pipe Costs Spartanburg/Greenville Pipe Costs $140.00 $120.00 $100.00 $80.00 $60.00 $40.00 $20.00 $- 4 6 8 10 12 14 16 18 20 Figure 1: Estimated Pipe Capital Costs by Pipe Diameter, for the Cities of Charlotte, Raleigh, and Spartanburg/Greenville. 10 | P a g e