Download
1 / 24
250 likes | 347 Views
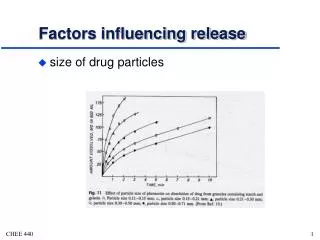
Sensitivity analysis of influencing factors on PM 2.5 nitrate simulation. ○ Shimadera H. 1 , Hayami H. 1 , Chatani S. 2 , Morino Y. 3 , Mori Y. 4 , Morikawa T. 5 , Yamaji K. 6 , Ohara T. 3 1 Central Research Institute of Electric Power Industry 2 Toyota Central R&D Labs., Inc.

E N D
Sensitivity analysis of influencing factorson PM2.5 nitrate simulation ○Shimadera H.1, Hayami H.1,Chatani S.2,Morino Y.3, Mori Y.4, Morikawa T.5, Yamaji K.6, Ohara T.3 1 Central Research Institute of Electric Power Industry 2 Toyota Central R&D Labs., Inc. 3 National Institute for Environmental Studies 4 Japan Weather Association 5 Japan Automobile Research Institute 6 Japan Agency for Marine-Earth Science and Technology the 11th Annual CMAS Conference October 16, 2012 This research was supported by the Environment Research and Technology Development Fund (C-1001) of the Ministry of the Environment, Japan.
Introduction • Fine particulate matter (PM2.5) has adverse health effects • In Japan, air quality standard for PM2.5 is not attained in many areas*1 • Air quality models (AQMs) are essential tools to seek effective measures • Current air quality models cannot sufficiently reproduce concentrations of PM2.5 and its components in Japan*2 *1Ministry of the Environment (2012) http://www.env.go.jp/press/press.php?serial=14869 *2Morino et al. (2010) J. Jpn. Soc. Atmos. Environ. 45, 212-226
UMICS:Urban air quality Model Inter‐Comparison Study • Focuses on PM2.5 components in the Kanto region of Japan • Uses common meteorological, emission and boundary data • Participants conduct sensitivity runs in their fields of expertise
Common dataset for UMICS2 Simulation domain • Horizontal D1: East Asia (64-kmgrids, 96x80) D2: East Japan (16-km grids, 56x56) D3: Kanto region (4-km grids, 56x56) • Vertical 30 layers (surface – 100 hPa) Elevation (m) Maebashi Kisai Tsukuba Saitama Komae D2 D3 D1 Observation sites for PM2.5components
Common dataset for UMICS2 Meteorological field • Meteorological model: WRF-ARW v3.2.1 • Simulation period Winter 2010: Nov. 15 – Dec. 5, 2010 Summer 2011: Jul. 11 – Jul. 31, 2011
Common dataset for UMICS2 Emission data Based on database described by Chatani et al.* • Anthropogenic D1: INTEX-B (SO2, NOX, CO, PM, VOC), REASv1.11 (NH3) D2, D3: Estimate model by JATOP (Vehicle), G-BEAMS (Others) • Ship D1: SAPA201112 by NMRI D2, D3: Emission inventory by OPRF • Biogenic VOC MEGAN v2.04with common meteorological field • Volcanic SO2 Volcanic activity reports by JMA *Chatani et al. (2011) Atmos. Environ. 45, 1383-1393
Common dataset for UMICS2 Boundaryconcentration • D1: MOZART-4results http://www.acd.ucar.edu/gctm/mozart/subset.shtml • D2, D3: CMAQ v4.7.1 with common dataset (Baseline case for UMICS2: M0)
Observation vs. Baseline Simulation Time series at Kisai Winter 2010 PM2.5 PM2.5SO42- (μg m-3) PM2.5OA PM2.5NO3- HNO3 (μg m-3) PM2.5EC PM2.5NH4+ NH3 (μg m-3)
Observation vs. Baseline Simulation Mean concentration at observation sites Winter 2010 (μg m-3) (μg m-3)
Observation vs. Baseline Simulation Time series at Kisai Summer 2011 PM2.5 PM2.5SO42- (μg m-3) PM2.5OA PM2.5NO3- HNO3 (μg m-3) PM2.5EC PM2.5NH4+ NH3 (μg m-3)
Observation vs. Baseline Simulation Mean concentration at observation sites Summer 2011 (μg m-3) (μg m-3)
Observation vs. Baseline Simulation Summary • PM2.5: mean concentrations were agreed, but temporal variations were not reproduced • PM2.5EC and SO42-: approximately reproduced • HNO3: diurnal variations were reproduced • PM2.5 OA: clearly underestimated • Being discussed in UMICS3 • PM2.5 NH4+: overestimated as NH4NO3 • NH3and PM2.5NO3-: clearly overestimated • Sensitivity analysis for influencing factors will be presented
Inter-comparison of baseline Sim. cases • Target period • Winter 2010: Nov. 22 – Dec. 5, 2010 • Summer 2011: Jul. 18 – Jul. 31, 2011 • Target area • 1st layer on land area < 200m ASL in D3 ( ) D3 *Using D2 result of M0 for boundary concentration
Inter-comparison of baseline simulation cases Time series of spatial mean Conc. Winter 2010 Summer 2011 PM2.5NO3- PM2.5NO3- (μg m-3) (μg m-3) PM2.5NH4+ PM2.5NH4+ (μg m-3) (μg m-3) • Using common dataset, temporal variation patterns in M0–M4 are very similar to each other
Inter-comparison of baseline simulation cases Difference of mean Conc. from M0 Winter 2010 Summer 2011 • M1, M3: relatively small difference between CMAQ v4.7.1 runs • phot_table→Inline reduce HNO3 and PM2.5 NO3- in summer • M3: yamo→ppm Adv. scheme increase ground-level Conc. • M2:CMAQ v4.6, ros3, aero4, radm, offline VD Calc. … • M4: Smaller Min. KZ in CMAQ v5.0 increase nighttime Conc. Difference from M0 (%)
Sensitivity analysis • Processes involved in PM2.5 NO3- production NOXEmiss. Daytime NH3Emiss. NO NO2 T & RH NH4NO3 NO3 HNO3 + NH3 Semi volatile N2O5 Dry Dep. Nighttime Het. Chem.
Sensitivity analysis T & RH (M0, D3) • Uniformly changed T in aerosol module by ±2 K • Uniformly changed RH in aerosol module by ±10% • T&RH affect not only gas/aerosol partitioning • RH is within the range of 0.5 – 99% Winter 2010 Summer 2011 Difference from baseline case of M0 (%)
Sensitivity analysis NOX emission (M1, D3) • Uniformly changed NOXemissionby from-40 to +40% • Uncertainty in total NOXemission is probably smaller Winter 2010 Summer 2011 Difference from baseline case of M1 (%)
Sensitivity analysis NH3 emission (M0, D2-D3) • Total emission changed by +52% in winter and -42% in summer in D3 Common data according to EMEP/CORINAIR EF Monthly emission ratio Modified according to process for N2O emission estimate in Japan winter summer Winter 2010 Summer 2011 Difference from baseline case of M0 (%)
Sensitivity analysis HNO3 & NH3 dry deposition VD (M2, D3) • Uniformly multiplied HNO3 & NH3 VD by 5 and 0.2 Neuman et al.* estimated higher daytime HNO3 VD (8 – 26 cm s-1) from measurement of power plant plumes Baseline VD (cm s-1) *Neuman et al. (2004) JGR 109, D23304 Winter 2010 Summer 2011 Difference from baseline case of M2 (%)
Sensitivity analysis N2O5 heterogeneous reaction (M0, D3) • Constant ΓN2O5 values: 0 (No React.) and 0.1 (Upper estimate) • Parameterization method of aero3 and aero4 (Baseline: aero5) N2O5 reaction probability Winter 2010 Summer 2011 Difference from baseline case of M0 (%)
Sensitivity analysis Mod. of multiple factors (M0, D1-D3) • Photolysis rate: photo_table→ photo_inline • PM2.5 NO3-: +3% in winter, -6% in summer • Modified seasonal variation of NH3 emission • PM2.5 NO3-: +11% in winter, -24% in summer • HNO3 & NH3 VD: 5 times • PM2.5 NO3-: -39% in winter, -46% in summer • N2O5 Het. Chem.: aero5 → aero3 • PM2.5 NO3-: -6% in winter, -4% in summer • M0_Base → ModMulti • PM2.5 NO3-: -39% in winter, -74% in summer Winter Difference from baseline case of M0 (%) applied simultaneously Summer
Modification of multiple factors (M0) Mean concentration at observation sites Winter 2010 (μg m-3) Summer 2011 (μg m-3)
Sensitivity analysis Summary • UMICS2 was conducted to improve AQM performance for simulating SIA, particularly PM2.5 NO3- • Using common dataset, results of CMAQ runs with different configurations were similar to each other • HNO3 & NH3 dry deposition and NH3 emission can be key factors for improvement of PM2.5 NO3- simulation • Accumulation of Obs. data of HNO3 & NH3 Conc. • Development of better NH3 emission inventory • Drastic modification of AQM may be required