Download
1 / 18
180 likes | 462 Views
Hor. 1. Hor. 2. Hor. 3. Lecture 10. Structural Analysis. Structural Analysis - What is it?. The analysis of all of the significant processes that formed a basin and deformed its sedimentary fill from basin-scale processes (e.g., plate tectonics)

E N D
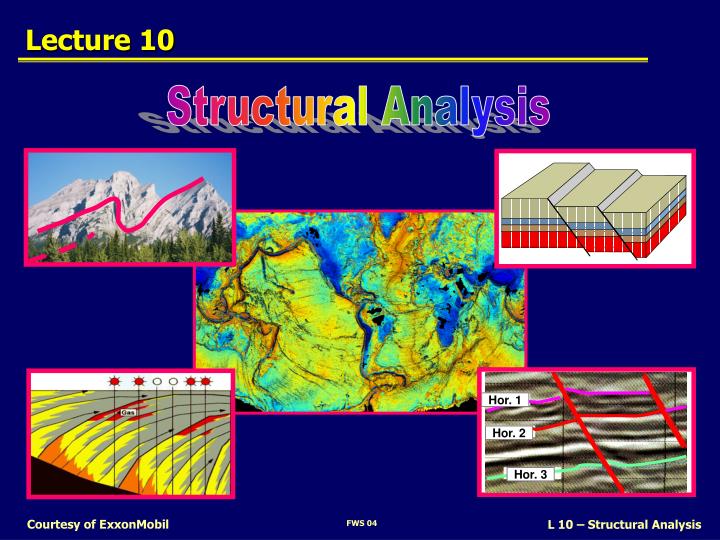
Hor. 1 Hor. 2 Hor. 3 Lecture 10 Structural Analysis Courtesy of ExxonMobil
Structural Analysis - What is it? The analysis of all of the significant processes that formed a basin and deformed its sedimentary fill from basin-scale processes (e.g., plate tectonics) to centimeter-scale processes (e.g., fracturing) • Some Major Elements: • Basin Formation • Fault Network Mapping • Stratigraphic Deformation • Present-Day Trap Definition • Timing of Trap Development Courtesy of ExxonMobil
Role of Seismic Interpretation • Identify and map faults, folds, uplifts, and other structural elements • Interpret structural settings and structural styles • Insure 3D geometric consistency in an interpretation - is it structurally valid? • Determine timing relationships, especially the timing of trap formation • Check if the interpretation is admissibility Courtesy of ExxonMobil
A Caution about Seismic Images Most seismic data is displayed in 2-way TIME, which can distort geometric relationships Watch the vertical exaggeration It changes with depth V:H is 1.3:1 At 1900 m/s V:H is 1:1 At 2500 m/s V:H is 0.9:1 At 3000 m/s V:H is 0.8:1 At 3500 m/s 1 km Courtesy of ExxonMobil
The STRENGTHS of Seismic Data • Inherently 3-D (even if a 2-D grid) • Able to image trap-scale structures • Able to image stratigraphy, to identify reservoir, seal, and for use as structural markers, e. g. to constrain fault offsets • Provides a 3-D context for understanding other data • surface geology • well data • potential field data Courtesy of ExxonMobil
The WEAKNESSES of Seismic Data • Limited resolution: can’t resolve “small” features • Steep dips can be difficult to image • Acquisition can be difficult, e. g. in areas of: variable topography, variable surface geology, or “hard” water bottom • Vertical axis is typically (migrated) time, not depth • Velocity variations distort geometries • Display scales are commonly not V:H=1:1, which results in distortions of geometries • Typically we can’t “see” hydrocarbons Courtesy of ExxonMobil
A ‘Synergistic’ Relationship You can not get all of the stratigraphic information without working the structure You can not get all of the structural information without working the stratigraphy Courtesy of ExxonMobil
Basic Observations: Profile View We can recognize moderate- to large-scale faults on seismic profiles by: • Termination of reflections • Offset in stratigraphic markers • Abrupt changes in dip • Abrupt changes in seismic patterns • Fault plane reflections • Associated folding or sag • Discontinuities Courtesy of ExxonMobil
Fault Identification: Time Slice View Do you see evidence for faults? 1856 ms Courtesy of ExxonMobil
Coherency Data Also known as Discontinuity or Variance A derivative data volume based on trace-to-trace correlation Data range from 0 to 1, (1 = neighboring traces are identical) • Amplitude Data Discontinuity 1856 ms 1856 ms Courtesy of ExxonMobil
Black Gray Transparent Corendering of Data 1. The amplitude data is displayed (red-blue) 2. The coherency data below user-defined thresholds is over-posted in black (very low values ) and gray (low values) Opacity for the Continuity Data 1856 ms Courtesy of ExxonMobil
A B C N S W E A B C tie Fault Identification: Profile Views Faults must tie on lines that intersect or the interpretation is not internally consistent Courtesy of ExxonMobil
Structural Observations Structural Concepts Interpreting Faults Courtesy of ExxonMobil
Structural Observations Structural Concepts • Tectonic Setting • Divergent zones • Convergent zones • Strike-slip zones • Mobile substrate • How Structures Evolve • Fault-bend folds • Fault-propagation folds • Salt movement • etc. • Fault segments on seismic lines • Fault plane orientation • Sense of motion • Magnitude of offset • Range of depths • Relative timing • when faults moved • when structures grew Interpreting Faults Courtesy of ExxonMobil
Structural Styles Matrix CONTRAC- TION UPLIFT, SUBSIDENCE EXTENSION LATERAL extensional fault blocks contractional fault blocks strike-slip or wrench faulting BASEMENT INVOLVED basement warps detached normal faulting BASEMENT DETACHED fold-and- thrust belts tear faults (detached) salt, shale diapirism Courtesy of ExxonMobil
1 mile Extensional Faults basement involved basement detached Courtesy of ExxonMobil
Diapirs Can Provide Good Traps Salt and shale layers can become mobile when subjected to differential loading Imaging beneath salt is very difficult, but the rewards can be great! Many oil and gas fields have been found associated with salt & shale diapirs Courtesy of ExxonMobil
Is the Interpretation Admissible? We can check the kinematic admissibility of a thrust fault interpretation by means of a 2-D sequential restoration Courtesy of ExxonMobil