Download
1 / 1
10 likes | 163 Views
Participant. Participant. Participant. Participant. Participant. SICD-R (months). CA (months). Lexigrams. Object to Object. Diagnoses. Blissymbols. Object to Photograph. Comprehension. PPVT-III (months). Object to Line Drawing. Vineland (months). Production.

E N D
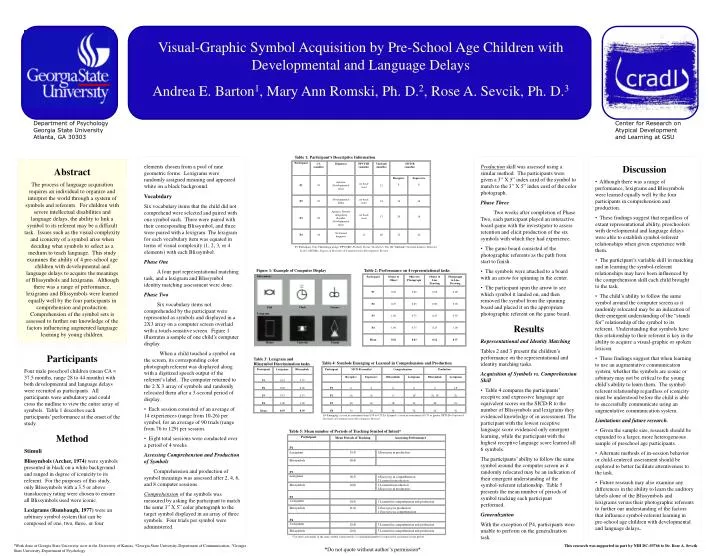
Participant Participant Participant Participant Participant SICD-R (months) CA (months) Lexigrams Object to Object Diagnoses Blissymbols Object to Photograph Comprehension PPVT-III (months) Object to Line Drawing Vineland (months) Production Photograph to Line Drawing SICD-R (months) Mean Periods of Tracking Assessing Performance P1 P1 P1 Receptive 0.25 0.00 Expressive 0.25 0.00 Blissymbols 0.00 Lexigrams Blissymbols 0.00 Lexigrams P1 39 Apraxia, Developmental delay no basal score 21 Receptive 8 Expressive 8 Lexigrams 15(5) 1Emerging in production P2 P1 P2 8 0.00 0.25 8 0.00 0.25 0 0.00 0 0 0.00 1E P2 39 Developmental Delay no basal score 24 16 16 Blissymbols 18(4) P2 P3 P3 16 0.33 1.00 16 0.33 0.75 0 0.25 1E 2L, 1E 0.50 2L P3 28 Apraxia, Sensory integration disorder, Developmental delay no basal score 17 20 16 P2 P4 P3 P4 20 1.00 1.00 16 1.00 0.75 1E 0.25 1L 2E 1.00 1L Mean P4 Mean 32 0.39 0.56 24 0.39 0.43 3L 0.12 3L 3L 0.37 3L Lexigrams 18(5) 1Emerging in comprehension 2 Learned in production P4 44 No formal diagnosis 21 68 32 24 Blissymbols 12(6) 2 Learned in production 1Emerging in production P3 Lexigrams 14(5) 1 Learned in comprehension and production Blissymbols 11(4) 2 Emerging in production 1 Emerging in comprehension P4 Lexigrams 12(4) 3 Learned in comprehension and production Blissymbols 12(6) 3 Learned in comprehension and production Visual-Graphic Symbol Acquisition by Pre-School Age Children with Developmental and Language Delays Andrea E. Barton1, Mary Ann Romski, Ph. D.2, Rose A. Sevcik, Ph. D.3 Department of PsychologyGeorgia State UniversityAtlanta, GA 30303 Center for Research on Atypical Development and Learning at GSU Table 1: Participant’s Descriptive Information • elements chosen from a pool of nine geometric forms. Lexigrams were randomly assigned meaning and appeared white on a black background. • Vocabulary • Six vocabulary items that the child did not comprehend were selected and paired with one symbol each. Three were paired with their corresponding Blissymbol, and three were paired with a lexigram. The lexigram for each vocabulary item was equated in terms of visual complexity (1, 2, 3, or 4 elements) with each Blissymbol. • Phase One • A four part representational matching task, and a lexigram and Blissymbol identity matching assessment were done. • Phase Two • Six vocabulary items not comprehended by the participant were represented as symbols and displayed in a 2X3 array on a computer screen overlaid with a touch-sensitive screen. Figure 1 illustrates a sample of one child’s computer display. • When a child touched a symbol on the screen, its corresponding color photograph referent was displayed along with a digitized speech output of the referent’s label. The computer returned to the 2 X 3 array of symbols and randomly relocated them after a 3-second period of display. • Each session consisted of an average of 14 experiences (range from 10-26) per symbol, for an average of 90 trials (range from 76 to 129) per session. • Eight total sessions were conducted over a period of 4 weeks. • Assessing Comprehension and Production of Symbols • Comprehension and production of symbol meanings was assessed after 2, 4, 6, and 8 computer sessions. • Comprehension of the symbols was measured by asking the participant to match the same 3” X 5” color photograph to the target symbol displayed in an array of three symbols. Four trials per symbol were administered. • Production skill was assessed using a similar method. The participants were given a 3” X 5” index card of the symbol to match to the 3” X 5” index card of the color photograph. • Phase Three • Two weeks after completion of Phase Two, each participant played an interactive board game with the investigator to assess retention and elicit production of the six symbols with which they had experience. • The game board consisted of the photographic referents as the path from start to finish. • The symbols were attached to a board with an arrow for spinning in the center. • The participant spun the arrow to see which symbol it landed on, and then removed the symbol from the spinning board and placed it on the appropriate photographic referent on the game board. • Results • Representational and Identity Matching • Tables 2 and 3 present the children’s performance on the representational and identity matching tasks. • Acquisition of Symbols vs. Comprehension Skill • Table 4 compares the participants’ receptive and expressive language age equivalent scores on the SICD-R to the number of Blissymbols and lexigrams they evidenced knowledge of in assessment. The participant with the lowest receptive language score evidenced only emergent learning, while the participant with the highest receptive language score learned all 6 symbols. • The participants’ ability to follow the same symbol around the computer screen as it randomly relocated may be an indication of their emergent understanding of the symbol-referent relationship. Table 5 presents the mean number of periods of symbol tracking each participant performed. • Generalization • With the exception of P4, participants were unable to perform on the generalization task. • Discussion • Although there was a range of performance, lexigrams and Blissymbols were learned equally well by the four participants in comprehension and production. • These findings suggest that regardless of extant representational ability, preschoolers with developmental and language delays were able to establish symbol-referent relationships when given experience with them. • The participant’s variable skill in matching and in learning the symbol-referent relationships may have been influenced by the comprehension skill each child brought to the task. • The child’s ability to follow the same symbol around the computer screen as it randomly relocated may be an indication of their emergent understanding of the “stands for” relationship of the symbol to its referent. Understanding that symbols have this relationship to their referent is key in the ability to acquire a visual-graphic or spoken lexicon. • These findings suggest that when learning to use an augmentative communication system, whether the symbols are iconic or arbitrary may not be critical to the young child’s ability to learn them. The symbol-referentrelationship regardless of iconicity must be understood before the child is able to successfully communicate using an augmentative communication system. • Limitations and future research. • Given the sample size, research should be expanded to a larger, more heterogeneous sample of preschool age participants. • Alternate methods of in-session behavior or child-centered assessment should be explored to better facilitate attentiveness to the task. • Future research may also examine any differences in the ability to learn the auditory labels alone of the Blissymbols and lexigrams versus their photographic referents to further our understanding of the factors that influence symbol-referent learning in pre-school age children with developmental and language delays. Abstract The process of language acquisition requires an individual to organize and interpret the world through a system of symbols and referents. For children with severe intellectual disabilities and language delays, the ability to link a symbol to its referent may be a difficult task. Issues such as the visual complexity and iconicity of a symbol arise when deciding what symbols to select as a medium to teach language. This study examines the ability of 4 pre-school age children with developmental and language delays to acquire the meanings of Blissymbols and lexigrams. Although there was a range of performance, lexigrams and Blissymbols were learned equally well by the four participants in comprehension and production. Comprehension of the symbol sets is assessed to further our knowledge of the factors influencing augmented language learning by young children. P= Participant; CA= Chronological Age; PPVT-III= Peabody Picture Vocabulary Test, III; Vineland= Vineland Adaptive Behavior Scales; SICD-R= Sequenced Inventory of Communication Development, Revised Figure 1: Example of Computer Display Table 2: Performance on 4 representational tasks Participants Four male preschool children (mean CA = 37.5 months, range 28 to 44 months) with both developmental and language delays were recruited as participants. All participants were ambulatory and could cross the midline to view the entire array of symbols. Table 1 describes each participants’ performance at the onset of the study. Method Stimuli Blissymbols (Archer, 1974) were symbols presented in black on a white background and ranged in degree of iconicity to its referent. For the purposes of this study, only Blissymbols with a 3.5 or above translucency rating were chosen to ensure all Blissymbols used were iconic. Lexigrams (Rumbaugh, 1977) were an arbitrary symbol system that can be composed of one, two, three, or four Table 3: Lexigram and Blissymbol Discrimination tasks Table 4: Symbols Emerging or Learned in Comprehension and Production E= Emerging- a score in assessment from 0.50 to 0.75 L= Learned- a score in assessment of 0.75 or greater SICD-R= Sequenced Inventory of Communication Development, Revised Table 5: Mean number of Periods of Tracking Symbol of Intent* *2 or more activations of the same symbol consecutively; ()= maximum number of consecutive activations in one period 1Work done at Georgia State University, now at the University of Kansas, 2Georgia State University-Department of Communication, 3Georgia State University-Department of Psychology This research was supported in part by NIH DC-03766 to Dr. Rose A. Sevcik *Do not quote without author’s permission*