Download
1 / 164
1.64k likes | 1.8k Views
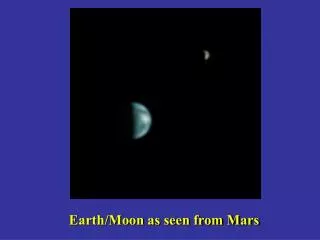
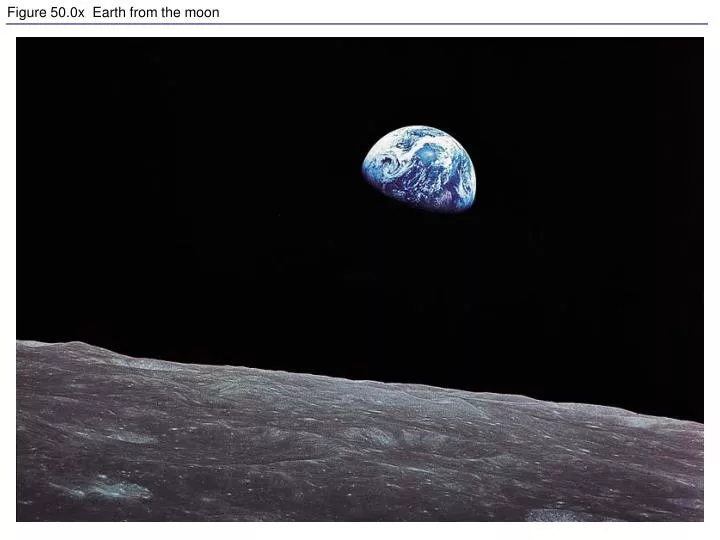
Figure 50.0x Earth from the moon. Figure 50.1 Distribution and abundance of the red kangaroo in Australia, based on aerial surveys. Figure 50.x1 Patterns of distribution in the biosphere. Figure 50.2 Sample questions at different levels of ecology. Figure 50.4 Biogeographic realms.

E N D
Figure 50.1 Distribution and abundance of the red kangaroo in Australia, based on aerial surveys
Figure 50.5 Flowchart of factors limiting geographic distribution
Figure 50.6 Set of transplant experiments for a hypothetical species
Figure 50.7 Spread of the African honeybee in the Americas since 1956
Figure 50.8 Expansion of the geographic range of the zebra mussel (Dreissenapolymorpha) since its discovery near Detroit in 1988
Figure 50.10 A climograph for some major kinds of ecosystems (biomes) in North America
Figure 50.13 Global air circulation, precipitation, and winds
Figure 50.15 Lake stratification and seasonal turnover (Layer 4)
Figure 50.16 Current geographic range and predicted future range for the American beech (Fagusgrandifolia) under two climate-change scenarios
Figure 50.19 Freshwater biomes: Oligotrophic lake (left), eutrophic lake (top right), stream flowing into a river (bottom right)
Figure 50.26 A hierarchy of scales for analyzing the geographic distribution of the moss Tetraphis
Figure 52.1 Aerial census for African buffalo (Syncerus caffer) in the Serengeti of East Africa
Figure 52.2 Patterns of dispersion within a population’s geographic range
Figure 52.2ax2 Clumped dispersion: buffalo, swans, fish, lupine
Table 52.1 Life Table for Belding Ground Squirrels (Spermophilus beldini) at Tioga Pass, in the Sierra Nevada Mountains of California
Table 52.2 Reproductive Table for Belding Ground Squirrels (Spermophilus beldingi) at Tioga Pass, in the Sierra Nevada Mountains of California
Figure 52.4 An example of big-bang reproduction: Agave (century plant)
Figure 52.5 Cost of reproduction in female red deer on the island of Rhum, in Scotland
Figure 52.6 Probability of survival over the following year for European kestrels after raising a modified brood
Figure 52.7 Variation in seed crop size in plants: Dandelion and coconut palm