Download
1 / 3
30 likes | 133 Views
9. 21. 1. 8. (G). HindIII. HindIII. Tdic101 insertion site. 15. 3. 16. 18. 5. 19. 20. 6. 2. 10. 4. 17. 23. 7. 13. 14. 26. 25. 11. 32. 29. 31. HindIII. 30. 28. 33. 24. 22. 12. 27. a. F3‘H. b. c. Tdic101. dTdic102.

E N D
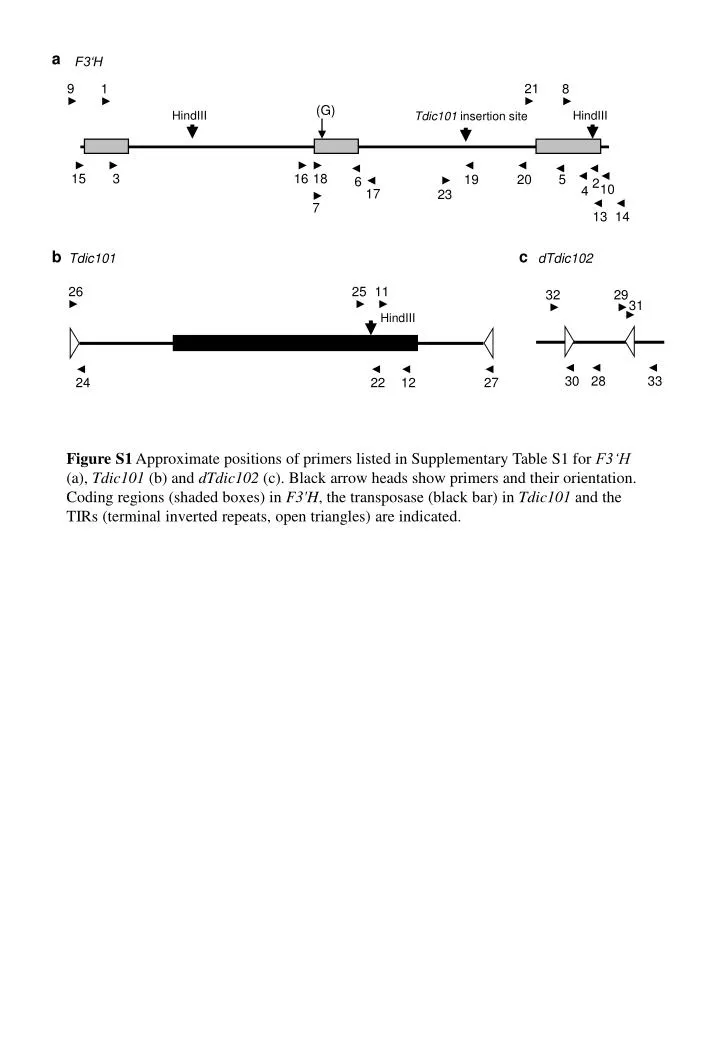
9 21 1 8 (G) HindIII HindIII Tdic101 insertion site 15 3 16 18 5 19 20 6 2 10 4 17 23 7 13 14 26 25 11 32 29 31 HindIII 30 28 33 24 22 12 27 a F3‘H b c Tdic101 dTdic102 Figure S1 Approximate positions of primers listed in Supplementary Table S1 for F3‘H (a), Tdic101 (b) and dTdic102 (c). Black arrow heads show primers and their orientation. Coding regions (shaded boxes) in F3'H, the transposase (black bar) in Tdic101 and the TIRs (terminal inverted repeats, open triangles) are indicated.
MPu MPi 1 2 3 4 5 6 7 8 (kbp) 23.1 9.4 6.6 2.3 2.0 1.1 0.8 Fig. S2 Analysis of the vacatedsite of the 4.3 kb (Tdic101) insertion in the F3‘H gene. PCR products are shown that are obtained with gene-specific primers on DNAs isolated from six different reverted, purple regions emerging in MPi flowers (1-6) or from pink regions in partly reverted variegated MPi flowers (7-8). Analysis by PCR of DNA isolated from MPu and MPi is shown and the migration of molecular weight markers is indicated on the left.
TPase (814 aa) A B C D E F 320 aa 88 aa 50 aa 226 aa 3 aa 1 aa 28 aa A; CKFNLTADVWDS D; VLDLLLWWKGQ B; HVRCACHVLNLCV E; LPVMSAMAQDFLSIQVSSVASERAFS C; TRWNSMYIML F; SKRVLDEKRTSLRSDTLEMCVCYKDW Fig. S3Schematic structure of the putative Tdic101 transposase (TPase). Black boxes represent the six conserved hAT-transposase motifs reported by Rubin et al. (2001). The number of amino acids (aa) separating these motifs in the Tdic101 TPaseare indicated.