Download
1 / 28
280 likes | 438 Views
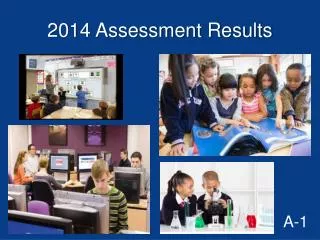
Charlotte-Mecklenburg Schools 2013-2014 End-of-Year Assessment Results September 4, 2014. 2014 Cohort Graduation Rate (4-Year). 2014 CMS Graduation Rate Exceeds the State Average. 4-Year Cohort Graduation Rate. CMS - 2010 to 2014 Change: + 15.3 points. 85.2. 82.5. 80.4. 77.9. 83.8.

E N D
Charlotte-Mecklenburg Schools 2013-2014 End-of-Year Assessment Results September 4, 2014
2014 CMS Graduation Rate Exceeds the State Average 4-Year Cohort Graduation Rate CMS - 2010 to 2014 Change: + 15.3 points 85.2 82.5 80.4 77.9 83.8 74.2 North Carolina Graduation Rate Source: NCDPI Cohort Graduation Rate, http://www.ncpublicschools.org/accountability/reporting/cohortgradrate Graduation Rate Calculation Method: http://www.ncpublicschools.org/docs/accountability/reporting/abc/2010-11/cohortgradratecalc11.pdf
Graduation Rates Have Increased for All Subgroups Source: NCDPI Cohort Graduation Rate, http://www.ncpublicschools.org/accountability/reporting/cohortgradrate Graduation Rate Calculation Method: http://www.ncpublicschools.org/docs/accountability/reporting/abc/2010-11/cohortgradratecalc11.pdf
Graduation Gaps Have Narrowed Dramatically Since 2010 Source: NCDPI Cohort Graduation Rate, http://www.ncpublicschools.org/accountability/reporting/cohortgradrate Graduation Rate Calculation Method: http://www.ncpublicschools.org/docs/accountability/reporting/abc/2010-11/cohortgradratecalc11.pdf
A Brief Look Back • In 2010, North Carolina joined 43 other states in adopting the Common Core • State Standards (CCSS), which define what students need to know and be able to do at each grade level to graduate ready for college and careers. • North Carolina public school students are required to meet a higher standard of proficiency on their End-of-Grade (EOG) and End-of-Course (EOC) tests. • The demands of the assessments and the scores required to reach proficiency • are now at a higher level. • Higher standards are a good thing—they are more challenging and focus on how students can apply the information they learn rather than simply memorizing the information. Source: http://www.dpi.state.nc.us/core-explained/faq/
The Impact of Higher Standards • Frequently, when state tests change, scores drop dramatically. • In 2012-13, North Carolina experienced these decreases. • North Carolina is not alone in this transition. Other states, • including New York, Kentucky, Tennessee, and Florida • administered Common Core–aligned assessments and each state • experienced substantial drops in proficiency in the first year of • administration. Source: http://www.dpi.state.nc.us/core-explained/faq/
Initial Performance in North Carolina • In 2013, North Carolina administered CCSS-aligned tests and increased expectations for students’ performance • Results on first round tests show the percent of students scoring “proficient” or better dropped by 20 percentage points or more NC Math 3-8 NC Reading 3-8 NC Science 5 and 8 83% 71% 77% 52% 42% 44% 2011-12 2012-13 2011-12 2012-13 2011-12 2012-13
Looking Forward: The State Has Redefined Performance as Grade Level Proficiency (GLP) and College and Career Readiness (CCR) • In 2013-14, the State Board of Education adopted a new methodology for • determining achievement levels of students: • The NC State Legislature is reviewing the future of Common Core, but the commitment • to the rigor that CCSS were intended to provide remains Source: http://www.dpi.state.nc.us/core-explained/faq/
CMS Proficiency Scores Increased Across All Tested Areas • Percent of Students At or Above Grade Level Proficiency +16.8 +11.3 +9.3 +13.9 +18.4 +11.5 2013 2014 L 3 & 4 L 3, 4, & 5 2013 2014 L 3 & 4 L 3, 4, & 5 2013 2014 L 3 & 4 L 3, 4, & 5 Note: 3rd Grade Reading C&C rate includes only End-of-Year assessment
CMS Experienced Gains in College and Career Readiness • in All Tested Subjects Except Reading • Percent of Students At or Above Proficient in 2013 and College and Career Ready in 2014 Note: 3rd Grade Reading C&C rate includes only End-of-Year assessment
CMS Experienced Gains in College and Career Readiness • in All Tested Subjects Except Reading • Percent of Students At or Above Proficient in 2013 and College and Career Ready in 2014
Our Priority is College and Career Readiness (CCR) • In the slides to follow, all comparisons will show Level 3 & 4 in 2012-13 and Level 4 & 5 in 2013-14. • Goal 1: Maximize student achievement in a personalized 21st-century learning environment for every child to graduate college and career ready
CMS is Outperforming the State Note: 3rd Grade Reading C&C rate includes only End-of-Year assessment
CMS Is Seeing Gains In Math, Science and EOCs Note: 3rd Grade Reading C&C rate includes only End-of-Year assessment
Subgroups: Math and Reading – Grades 3-8 Science Grades 5 & 8 Math I, English II, & Biology 2012-13 & 2013-14
Proficiency Rates are Increasing in Grades 3-8 Reading GLP CCR SWD: Students with Disabilities; LEP: Limited English Proficient; EDS: Economically Disadvantaged Note: 3rd Grade Reading C&C rate includes only End-of-Year assessment
All Subgroups are Seeing Gains in Grades 3-8 Math GLP CCR SWD: Students with Disabilities; LEP: Limited English Proficient; EDS: Economically Disadvantaged
All Subgroups are Seeing Gains in Grades 5 & 8 Science GLP CCR SWD: Students with Disabilities; LEP: Limited English Proficient; EDS: Economically Disadvantaged
All Subgroups are Seeing Gains in English II GLP CCR SWD: Students with Disabilities; LEP: Limited English Proficient; EDS: Economically Disadvantaged
All Subgroups are Seeing Gains in Math I GLP CCR SWD: Students with Disabilities; LEP: Limited English Proficient; EDS: Economically Disadvantaged
All Subgroups are Seeing Gains in Biology GLP CCR SWD: Students with Disabilities; LEP: Limited English Proficient; EDS: Economically Disadvantaged
Schools Meeting or Exceeding Expected Growth: 2012-13 & 2013-14
School Growth • School Growth is an indication of the average rate at which students in a school learned over the past year. • The standard is roughly equivalent to a year’s worth of expected • growth for a year of instruction. • The growth measure is defined in one of three ways: • did not meet expected growth; • met expected growth; or • exceeded expected growth. Source: http://www.dpi.state.nc.us/core-explained/faq/
More CMS Schools are Meeting or Exceeding Growth in 2013-14 * Three schools did not have data in this category, as provided by EVAAS/NC (Metro, Lincoln Heights, Cato Middle College).
In Summary • CMS has improved in performance on nearly every EOG and EOC subject tested, although reading is still a concern in several grades. • CMS has outperformed the state average in virtually every EOG and EOC subject tested for the second year in a row. • All subgroups of students made progress from 2012-13 to 2013-14. • Nearly 83% of our schools are meeting or exceeding growth • expectations. Source: http://www.dpi.state.nc.us/core-explained/faq/
Action Moving Forward: 2014-15 and Beyond
The Work Ahead • Strategic Plan 2018: For a Better Tomorrow focuses on raising academic achievement: • Academic growth and high academic achievement • Bring to scale a dynamic teaching and learning framework that ensures high-quality instruction • Closely monitor academic progress, with a priority focus on subgroups • Focus on transition years for reading instruction • Individualize professional development • Expand the capacity of professional learning communities to accelerate student achievement and eliminate achievement gaps • Build the capacity of teachers to use alternative teaching methods • Strategic use of district resources • Strengthen alignment of central and school-based resources to maximize student support • Enhance the quality and effective use of instructional and non-instructional resources • Expand use of data as part of continuous improvement efforts