Download
1 / 21
210 likes | 271 Views
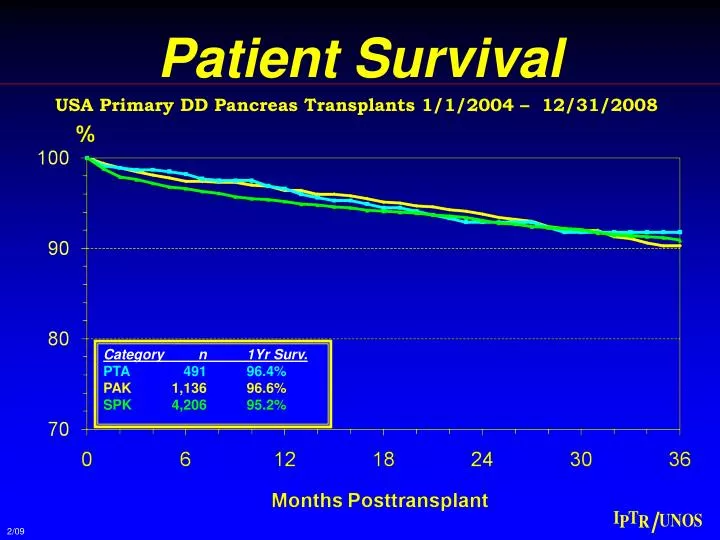
Patient Survival. USA Primary DD Pancreas Transplants 1/1/2004 – 12/31/2008. Category n 1Yr Surv. PTA 491 96.4% PAK 1,136 96.6% SPK 4,206 95.2%. 2/09. Major Causes of Patient Death. USA Primary DD Pancreas Transplants 1/1/2004 – 12/31/2008. %. SPK. PAK. PTA.

E N D
Patient Survival USA Primary DD Pancreas Transplants 1/1/2004 – 12/31/2008 Category n 1Yr Surv. PTA 491 96.4% PAK 1,136 96.6% SPK 4,206 95.2% 2/09
Major Causes of Patient Death USA Primary DD Pancreas Transplants 1/1/2004 – 12/31/2008 % SPK PAK PTA 0-3 3-12 > 12 0-3 3-12 > 12 0-3 3-12 > 12 Months Posttransplant 3/09
1-Year Patient Survival USA Primary DD Pancreas Transplants 1/1/2004 – 12/31/2008 3/08
Higher Risk Lower Risk Factors for Patient Survival USA DD Primary Pancreas Transplants, 1/1/2004 – 12/31/2008
Pancreas Graft Function USA DD Primary Pancreas Transplants 1/1/2005 – 12/31/2009 Cat. n 1Yr Fxn SPK 4,146 85% PAK 947 79% PTA 465 78% p < 0.0001 3/10
Pancreas Graft Function USA DD Primary Pancreas Transplants 1/1/2004 – 12/31/2008 DWFx Pancreas censored Cat. n 1Yr Fxn PAK 1,136 81.0% PTA 491 81.0% SPK 4,200 88.2% p < 0.0001 3/09
Major Causes of Px Graft Failure USA Primary DD Pancreas Transplants 1/1/2004 – 12/31/2008 % SPK PAK PTA 0-<3 3-<12 ≥ 12 0-<3 3-<12 ≥ 12 0-<3 3-<12 ≥12 Months Posttransplant 3/09
1-Year Pancreas Graft Function USA DD Primary Pancreas Transplants 1/1/2000 – 12/31/2007 4/06
Higher Risk Lower Hazard Ratio for Pancreas Graft Loss USA DD Primary Pancreas Transplants, 1/1/2000 – 12/31/2005 PTA SPK PAK Donor Age
Higher Risk Lower Hazard Ratio for Pancreas Graft Loss USA DD Primary Pancreas Transplants, 1/1/2000 – 12/31/2007
1-Year Pancreas Graft Function USA DD Primary Pancreas Transplants 1/1/2000 – 12/31/2006 4/08
1-Year Pancreas Graft Function USA DD Primary Pancreas Transplants 1/1/2000 – 12/31/2006 4/06
Higher Risk Lower Hazard Ratio for Pancreas Graft Loss USA DD Primary Pancreas Transplants, 1/1/2000 – 12/31/2005 SPK PAK PTA Preservation Time [hrs]
Technical Failure Rate USA DD Primary Pancreas Transplants 1/1/2000 – 12/31/2005 P = 0.0001 Donor Cause of Death
Graft Thrombosis Rate USA DD Primary Pancreas Transplants 1/1/2000 – 12/31/2005 P = 0.0001 Donor Cause of Death
Higher Risk Lower Hazard Ratio for Technical Failure USA DD Primary Pancreas Transplants, 1/1/2000 – 12/31/2005 SPK PAK PTA Donor Age
Higher Risk Lower Hazard Ratio for Graft Thrombosis USA DD Primary Pancreas Transplants, 1/1/2000 – 12/31/2005 SPK PAK PTA Donor Age
Higher Risk Lower Hazard Ratio for Graft Thrombosis USA DD Primary Pancreas Transplants, 1/1/2000 – 12/31/2005
Immunological Pancreas Graft Loss USA Primary TS DD Pancreas Transplants 1/1/2004 – 12/31/2008 Cat. n 1Yr Loss PTA 445 6.0% PAK 1,016 5.5% SPK 3,879 2.1% p = 0.0001 3/09
Even the Highest Risk Patients Do Better with a SPK than Remaining on the Waiting List UNOS Pancreas Waiting List 1/1/1995– 5/31/2003 University of Minnesota SPK Recipients 2/04