Download
1 / 50

E N D
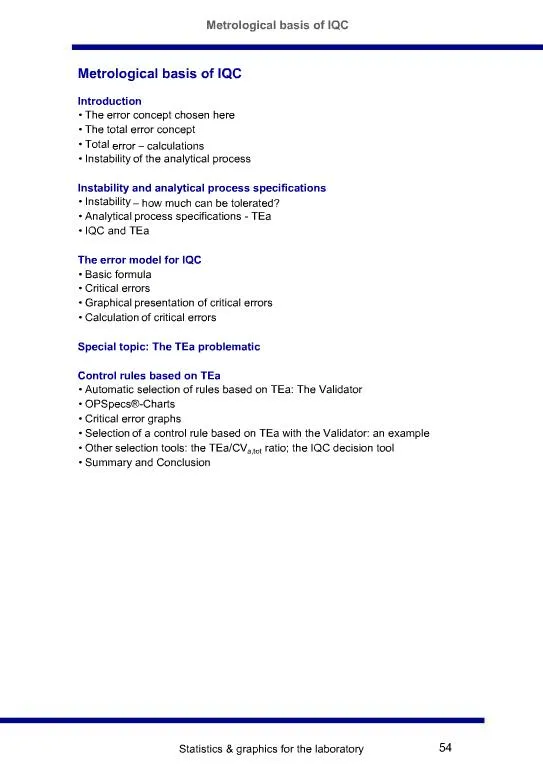
1. Statistics & graphics for the laboratory 54 Metrological basis of IQC Introduction
The error concept chosen here
The total error concept
Total error � calculations
Instability of the analytical process
Instability and analytical process specifications
Instability � how much can be tolerated?
Analytical process specifications - TEa
IQC and TEa
The error model for IQC
Basic formula
Critical errors
Graphical presentation of critical errors
Calculation of critical errors
Special topic: The TEa problematic
Control rules based on TEa
Automatic selection of rules based on TEa: The Validator
OPSpecs�-Charts
Critical error graphs
Selection of a control rule based on TEa with the Validator: an example
Other selection tools: the TEa/CVa,tot ratio; the IQC decision tool
Summary and Conclusion
2. Statistics & graphics for the laboratory 55 Introduction FOREWORD
Currently, there is confusion about metrological terms. While the term error is used in the metrological �bible� (VIM [1]), it is deprecated in one of the recent ISO concepts (GUM [2]). This concept, even, recommends to avoid the distinction between random and systematic effects (= uncertainty concept: GUM).
Moreover, ISO uses the concept of accuracy [3]:
Accuracy = Combined trueness & precision
Inaccuracy = Combined ([untrueness]: note: this term is not defined by ISO) and imprecision.
Note: Some traditions link accuracy to systematic error.
This book uses the [total] error concept (Adapted from: St�ckl D. Scand J Clin Lab Invest 1996;56:193-7):
Total-, systematic-, and random error
[In]Accuracy: combined [�un�]trueness and [im]precision
Experimental estimates: Total error, bias, SD
Note: all experimental estimates have a statistical uncertainty!
References
[1] ISO VIM. Vocabulaire international des terms fondamentaux et g�n�raux de m�trologie.
[2] ISO GUM. Guide to the expression of uncertainty in measurement.
[3] ISO 5725-1. Accuracy (trueness and precision) of measurement methods and results.
3. Statistics & graphics for the laboratory 56 The total error (TE) concept The term "total error" (TE) (#) is applied to measurement results that are influenced by random (RE) and systematic (SE) components of error.
Calculation of TE for single measurements:
TE = SE + z � RE, or TE = SE + z � s
(z is usually set to 1.96 or 2.58, encompassing 95% or 99% [two-tailed] of a gaussian distributed population)
Calculation of TE for multiple measurements:
TE = SE + tn-1 � [s/?n]
s = the standard deviation, n = number of measurements, tn-1 = student's t-value for (n-1) degrees of freedom (e.g., at the 95 % confidence level)
Note: Random error can be reduced by increasing the number of measurements, systematic error cannot.
Instability of the analytical processes
Due to occurrence of systematic error (1)
Due to increased random error (2)
References
#Random, systematic, and total error of measurement [adapted from: Westgard JO, Barry PL. Cost-effective quality control. 4th printing. Washington: AACC Press, 1995]
4. Statistics & graphics for the laboratory 57 Instability � how much can be tolerated?
The answer is: ? Poor analytical quality must not invalidate the medical decision!
The conclusion is: We have to know the medical requirements for analytical quality (�analytical process specifications�) ? Allowable total error (TEa).
Analytical process specifications - TEa
Concepts and numerical examples can be found in the literature below (#).
Note: Optimally, TEa should be medically justified!
IQC and TEa
Observation
The statistically defined "stop-limit" of IQC (TEIQC; e.g., 3 s) may be much lower than medically relevant (e.g., triacylglycerides).
The idea
Let's stop the process at a medically relevant (or otherwise defined) allowable total error: TEa (TEa: also called "quality specification").
Advantages
If TEa >> TEStable,
"very loose" IQC-rules can be selected.
Prerequisite for IQC
TEstable < TEa
There must be some room left for the IQC-procedure
Note: IQC cannot transform an intrinsically poor method into a good method
#References
Strategies to set global analytical quality specifications in laboratory medicine. Consensus Statement, Stockholm 1999. Scand J Clin Lab Invest 1999;59:585
St�ckl D, Baadenhuijsen H, Fraser CG, Libeer J-C, Hyltoft Petersen P, Ric�s C. Desirable routine analytical goals for quantities assayed in serum. Eur J Clin Chem Clin Biochem 1995;33:157-69.
www.westgard.com Instability and analytical process specifications
5. Statistics & graphics for the laboratory 58 The error model for IQC Basic formula (#)
TE = Bias + [?SEcont � smeas] + z � [?REcont � smeas]
Bias: method bias, usually assumed to be zero
?SEcont: change in systematic error that can be detected by the quality control procedure
smeas: measured, intrinsic standard deviation of the test
?REcont: change in random error that can be detected by the quality control procedure
z: statistical multiplier related to the portion of a distribution exceeding a quality requirement ("defect rate")
Note: mostly, a z-value of 1.65 is selected to obtain a 5% defect rate (one-tailed). When pure random error is addressed, a z-value of 1.96 is selected to obtain a 5% defect rate (two-tailed).
Critical random and systematic error definition:
The amount of error that places 5% of results outside TEa.
The role of IQC is to detect process deterioration before >5% of the results exceed TEa.
Graphical presentation of critical errors
References
# Westgard JO, Barry PL. Cost-effective quality control. 4th printing. Washington: AACC Press, 1995]
6. Statistics & graphics for the laboratory 59 Calculation of critical errors Assumption of imprecision and bias
Critical random error (?REc) and critical systematic error (?SEc) can be calculated that cause measurements to exceed TEa in 5% of the cases (= defect rate) due to either increased imprecision or increased systematic error.
Formulae for a 5% defect rate:
Case with ?SEc = 0
?REc = (TEa - bias)/1.96 � smeas;
Case with ?REc = 1
?SEc = [(TEa - bias)/smeas] - 1.65
Assumption of zero bias
For the purpose of IQC, the bias of the method often is assumed to be zero.
This is justified if a laboratory establishes its own IQC target values or if it can verify the system-specific target values of commercial IQC materials.
Formulae for ?REc and ?SEc with bias = 0
?REc = TEa/1.96 � smeas;
?SEc = (TEa/smeas) - 1.65
Note: For simplification, the QC-Validator� program applies the default factor 2 (for RE and SE) for the stable process (elder versions: 1.65!). The factor may be changed by the user.
Checklist � Metrology and rule selection
Metrology, knowledge of
The total error concept (TE, SE, RE)
Concept of maximum allowable total error (TEa) (process specifications)
Critical error
Rule selection
Statistical basis: A rule is chosen based on Pfr and Ped. SD-limits are taken from stable performance.
TEa basis: From a specification for TEa, critical error values can be calculated.
From the critical error values, adequate IQC rules can be selected, naturally, on statistical basis.
Selection tools: power functions, OPSpecs, the TEa/CVa,tot ratio; the IQC decision tool
7. Statistics & graphics for the laboratory 60 Special topic: the TEa problematic Introduction
Specifications for TEa, the concepts
Clinical
Biological
Notes on IQC rules based on biological TEa
IQC rules from biological TEa and reality
Expert
Summary
Checklist � TEa values
8. Statistics & graphics for the laboratory 61 Introduction BEWARE
There are a lot of misunderstandings when selecting a TEa for IQC purposes.
We look into TEa in more detail!
Questions
What is a responsible choice for TEa?
Is there a consensus about TEa?
Investigate current concepts for establishing values for TEa.
Specifications for TEa
Current concepts for TEa
The Table below lists, in hierarchical order, current concepts for establishing values for TEa.
Sources (in hierarchical order#)
Clinical concepts (few analytes)
Concepts based on biological variation
Expert opinion
Regulations
"State-of-the-art"�
#Consensus Statement (Stockholm 1999). Scand J Clin Lab Invest 1999;59:585. See also: ISO 15196
9. Statistics & graphics for the laboratory 62 Specifications for TEa Inspection of proposed numbers for TEa
EXAMPLE: Serum-sodium
When we compare the currently proposed numbers, we can conclude that:
There is no consensus about TEa!
Additionally: TEa may depend on concentration/disease
10. Statistics & graphics for the laboratory 63 TE from biology BUT: Some are too stringent for current technology
Biology gives extreme low values for some analytes:
TEa sodium: Ricos: 0.9% (http://www.westgard.com/biodatabase1.htm; but note: CVg on that site = CVb)
? Apply a bottom-line#
#St�ckl D. Desirable Performance criteria � based on biological analyte variation - hindrances to reaching some and reasons to surpass some. Clin Chem 1993;39:913-4.
Bottom-line (for stable process!)
CV: 1%
Bias: 1,5%
TE: 3,2%
Consider to surpass some
Think about using more stringent goals than derived from biology ? the goals are a compromise; account for IQC; some goals are surpassed, by far, by current technique.
St�ckl D. Desirable Performance criteria � based on biological analyte variation - hindrances to reaching some and reasons to surpass some. Clin Chem 1993;39:913-4.
Tonks: 10% upper limit for TE
11. Statistics & graphics for the laboratory 64 Proposed numbers � How realistic are they? The numbers proposed by clinical and biological concepts, usually, are desirable numbers (= goals), which would allow medical decisions to be made without compromise of analytical quality. However, the laboratory has to work with �real numbers� = �state-of-the-art� quality.
Comparison of reality with �goals� from biology
The Figure below compares ��state-of-the-art� quality with desired quality: 1/4 of the reference interval.
[1] TEa = � of the reference interval
[2] State-of-the-art total CVa.
*Rules calculated with the above TEa and CV values by the Validator
(90% assurance; 2 materials; bias: Na 0.5%, Trigl 2%, others: 1%).
Observation
Some state-of-the-art CVs are too big to allow calculation of IQC-rules from biology-derived TEa values, for example, for ? sodium.
Expert TEa values
Sodium: other numbers
Koch, Westgard et al. Clin Chem 1990;36:230-3.
We have seen that sodium was a problem for IQC with TEa values derived from biology. For others, however, sodium seems to be very easy for IQC (see below). They propose a 3.5 s rule.
Note: TEa was chosen by experts and was the US EQA-limit (2.9%). Additional, their �state-of-the-art� CV (0.5%) seems to be quite optimistic!
CONCLUSION
Don�t cheat yourself by selecting the most liberal TEa values and by underestimating your actual CV.
12. Statistics & graphics for the laboratory 65 More on expert TEa values Below, are shown more examples of IQC rule setting by use of expert TEa values (upper example) and by general expert opinion (lower example).
Koch, Westgard, et al. Clin Chem 1990;36:230-33 (see also : Westgard & Stein. Clin Chem 1997;43:400-3).
Based on �expert� TEa values, following rules were proposed:
13.5s (n = 2) for: Sodium (TEa = 2.9%, CV = 0.5%), potassium, urea nitrogen, creatinine, phosphate, uric acid, cholesterol, total protein, total bilirubin, GGT, ALP, AST, and LD.
12.5s (n = 2) for: Chloride, total CO2.
Calcium was a problem: Compared to TEa, precision was considered as too poor.
Mugan, Carlson, Westgard. J Clin Immunoassay 1994;17:216-22.
12.5s (n = 3) for: Prolactin, �-hCG, CEA, FSH, LH, TSH, �2-microglobulin.
? Experts tend to simple rules; choice is not directly related to medical requirements
Rules selected by general opinion
Steindel SJ, Tetrault G. Arch Pathol Lab Med 1998;122:401-8.
2.5 � 2.7s rule: generally
Tetrault GA. CAP Today 1995 (April):60-1.
3.5 s rule: generally
? Experts tend to simple rules; choice is often more related to considerations about Pfr than to medical requirements. Sometimes, experts change their minds.
Observations
? Experts tend to simple rules; choice is not directly related to medical requirements
? Choice is often more related to considerations about Pfr than to medical requirements. Sometimes, experts change their minds.
13. Statistics & graphics for the laboratory 66 TEa and IQC Summary
Different models give different TEa values
Additionally: TEa may depend on concentration/disease
� Many proposals do not account for the needs of IQC
� Some values that are recommended are beyond the state-of-the-art of routine methods, or give IQC rules with high Pfr
Experts tend to simple rules; choice is often more related to considerations about Pfr than to medical requirements. Sometimes, experts change their minds.
Don�t choose the most convenient TEa.
The most useful general purpose TEa numbers result from the concept of biological variation.
But, apply bottom-line values
Checklist � TEa values
Apply TEa values from the following hierarchy
1. Clinical models (e.g., cholesterol; glucose)
2. Biological variation (obtain the database)
Bottom-line values
No numbers from 1-2: 3. Expert models
No numbers from 1-3: 4. Regulation
No numbers from 1-4: 5. Better state-of-the-art
Note: Critically review the proposed numbers.
14. Statistics & graphics for the laboratory 67 Control rules based on TEa Automatic selection of rules based on TEa: The Validator
OPSpecs�-Charts
Critical error graphs
Selection of a control rule based on TEa with the Validator: an example
Other selection tools: the IQC decision tool; the TEa/CVa,tot ratio;
Summary and Conclusion
15. Statistics & graphics for the laboratory 68 Selection of control rules based on TEa Tools for IQC rule decision based on TEa
The Westgard software tools (OPSpecs� chart)
The STT IQC decision tool
The ratio of TEa/total-CVa: should be >4
Automatic selection of rules based on TEa: The Validator�
Based on the TEa concept and the calculation of critical errors, the Validator software allows an automatic selection of the most appropriate control rule.
OPSpecs-charts
The Validator makes use of so-called OPSpecs-charts (�Charts of Operational Process Specifications�) to relate TEa and stable method performance (bias and imprecision) with IQC-rule selection.
Based on a preselected TEa, these charts allow to select IQC rules for different combinations of bias/imprecision (see Figure).
The charts are specific for a specific total error requirement, for example, a chart for a TEa of 5% will differ from one requiring 2%.
A selection between QC procedures for systematic error or random error has to be made and the probability level for error detection has to be specified, for example, 90% (80% for RE), 50%, etc (OPSpecs�-Charts for RE not in EZ rules!).
Imprecision is plotted on the x-axis and bias is plotted on the y-axis. Stable imprecision and bias are plotted as operating point (Figure: 2%/0%).
A selection of IQC-rules is presented.
16. Statistics & graphics for the laboratory 69 Critical error graphs The Validator�
Additionally, it shows the power functions of the rules with indication of the critical error (= critical error graphs).
Critical error graphs are made for systematic and random error, separately.
They show the power functions for the IQC rules that the Validator proposes.
Additionally, a box is presented that indicates Pfr and Ped of the respective rules.
The critical error is indicated by a vertical line. Usually, it should intersect the power functions at Ped values >0.9 (=90% for error detection).
?Note: for the RE graph, the critical error line intersects most power functions at values <0.9. This indicates the generally weaker power of these rules to detect random error!
17. Statistics & graphics for the laboratory 70 Selection of a control rule based on TEa EXAMPLE
Analyte
Cholesterol
TEa
13%: From German EQA (RILIB�K)
Assumed stable performance
Bias: 0%
CVa,tot: 2%
Apply the Validator
See OPSpecs-chart
?The Validator selects a very convenient rule: 13.5s.
Note: powerful control rules are at the right in the OPSpecs!
Conclusion
If TEa is high: �Easy� rules are selected
? Attractivity of the approach
WHAT, if TEa is low?
? Will be discussed later under the topic IQC-POLICY
18. Statistics & graphics for the laboratory 71
The Figure shows a simplified version of an OPSpecs� chart.
Construction of the lines:
TE = SE + k � RE; at RE = 0: SE = TE;
? all lines start at {RE=0;SE=TE}; they stop at {RE=TE/k, SE=0}
According to the Westgard approach, the operating point of your test (= stable performance) should be left of the TE line with k = 4. If the operating points is located on the right, the TE cannot be controlled in 90% of the cases by IQC.
REMEMBER
TEa (preselected!) = SE + k � RE (SE & RE are calculated from TEa)
For the stable process: k = 1.65 or 1.96
For the IQC controlled process: k = 4
Graphical comparison of the process at TEa and of your actual, IQC controlled process (see figure above, the two X-es)
The Figure shows the room for method instability (bias and imprecision) of a process that is controlled with the Westgard approach.
Note, the process at TEa, exceeds the TEa in 5% of the cases.
REMARK: TE of the IQC controlled process is ~50% of the stable process!
The OPSpecs� chart: a more detailed look
19. Statistics & graphics for the laboratory 72 Remark on the location of the operating point The Figures below show the expected measurement populations (for different k values) for
an operating point with a low ratio SE/RE (upper Figure)
an operating point with a high ratio SE/RE (lower Figure).
Observations
For low SE/RE ratios, the IQC controlled process is in a robust situation: additional SE does not move it out of TEa.
For high SE/RE ratios, the IQC controlled process is in a labile situation: additional SE quickly moves it out of TEa.
CONCLUSION
The ratio SE/RE that contributes to a TEa is important!
20. Statistics & graphics for the laboratory 73
As already addressed before, different Validator� versions may use different default k values for the stable process:
- Either 1,96: pure RE
- Or 1.65: pure SE
Usually, both components are present. In practice, there is a gradual move from 1.96 to 1.65 when SE moves from 0 to SE = RE. If SE > RE, the multiplier 1.65 is justified. This has also implications for the IQC controlled process. For this reason, the STT variant was developed.
IQC decision tool � the STT variant
The variant is based on the OPSpecs� charts. From RE = 0, the lines with k = 1.65 (k = 4) are used up to SE = RE. However, from that point on, a line is drawn to the RE point that corresponds to TE/2 (TE/4.85).
Other selection tools
21. Statistics & graphics for the laboratory 74 The ratio of TEa/total-CVa (EXCEL-file) The ratio of TEa/total-CVa allows a quick estimate of test performance. This ratio should be >4. However, the ratio depends strongly on the TEa chosen (see also discussion later: special topic TEa problematic).
REMARK: bias is not considered by that tool!
The EXCEL-file contains a nearly complete list of TEa and state-of-the-art CVa values for the following analyte groups:
Ion selective electrode (ISE)
Substrates
Enzymes
Specific proteins
Therapeutic drug monitoring (TDM)
TEa criteria are:
Ricos et al., or
1/6th of the reference (therapeutic) interval
CVa data
State-of-the-art
Summary
IQC rule selection can proceed via
Statistics
TEa and statistics
? Development of an IQC policy has to consider both possibilities.
Conclusion
Because regulation and manufacturer recommendations describe minimum IQC, only, the laboratory has to develop an IQC policy itself.
The IQC-policy of the laboratory has to respect statistical and medical aspects and should be developed according to the needs of the laboratory, naturally, respecting the guiding rules of regulation.
Development of IQC policy
? Laboratory task
22. Statistics & graphics for the laboratory 75 IQC policy Introduction
Software
Samples
Frequency (& location) of IQC measurements
Performance (State-of-the-art)
IQC rule selection
Patient release
Process control
Examples
IQC rules for state-of-the-art performance
Screening with TEa/CVa,tot
STT IQC decision tool
EZ rules/Validator
Special topics
Calculation of an actual TE[a]
Rule �n� and patient release
Dealing with a bias
IQC rules with wide limits (e.g. 6s) and lot variations
�Fine-tuning� of IQC according to instability
Remedial actions &
Pfr of the IQC rule and frequency of remedial actions
CVa,tot /CVa,w ratio
Inspecting IQC charts
Summary
23. Statistics & graphics for the laboratory 76 Introduction The IQC policy will be developed on the basis of the Belgian situation:
RECALL: Koninklijk Besluit
Art. 34. �1. The laboratory director has to organize IQC in all disciplines.
�3. IQC consists of several procedures which allow, before the release of patient results, to detect all significant within- or between-day variations: Remedial actions policy/rule selection
Art. 35. �1. The frequency of control measurements has to be such that it can guarantee a clinically acceptable imprecision. This frequency depends on the characteristics of the method and/or the instrument: Additional: Praktijkrichtlijn
Control rules used for start and for acceptance of a run ? at least 2 IQC events.
Rule selection/frequency
�2. The control material, � must be stable within a defined period of time. Different aliquots of the same lot must be homogeneous;
Concentrations: Praktijkrichtlijn.
Sample requirements
�3. For each new lot, the mean and the SD have to be determined. � IQC materials may, at the same time, not be used as calibrator and control material: Establish stable performance: own targets!
24. Statistics & graphics for the laboratory 77 Introduction On the basis of the Belgian regulation, we will apply all input elements that we have seen to the analytes ISE; substrates; enzymes, specific proteins; TDM.
The elements we have seen (see also �ckecklists�) were:
�Knowledge-base�
-Statistics
-Rule selection
-Metrology/Error concept for IQC
-TEa data, biological variation
State-of-the-art performance data
-CVa,tot, CVa,w
-Experience from "Peer-IQC"
-Laboratory experience
(also: Questionnaire to participants)
Software tools
-Laboratory IQC software
-EZ-rules
-IQC decision tool/Ratio TEa/CVa,tot
From established rules, we look at the magnitude of undetected errors (e.g., in 10% of the cases)
?Additionally, we will address the topic
-Remedial actions.
We will develop the policy in an interactive way.
We start with the Laboratory IQC software (see also checklist).
25. Statistics & graphics for the laboratory 78 IQC-software Discussion
��������������������������������������������������������������������������������������������������������������������������������������������������������������������������������������������������������������������.������������������������������������������������������������������������������������������������������������������������������������������������������������������������������������������������������������������������������������������������������������������������������������������������������������������������������������������������������������������������
26. Statistics & graphics for the laboratory 79 The IQC sample Samples: �2. The control material, � must be stable within a defined period of time. Different aliquots of the same lot must be homogeneous.
Concentrations: Praktijkrichtlijn
See also checklist � Samples
? Select commercial one
Note: In principle, their target and range cannot be used by the laboratory (Art. 35. �3.) (�3. For each new lot, the mean and the SD have to be determined).
Consider participation in an IQC "Peer"-system
Sample advantages due to the high number of participants
System specific target means and SDs
Low target uncertainty
Control of sample stability
Discussion
��������������������������������������������������������������������������������������������������������������������������������������������������������������������������������������������������������������������.��������������������������������������������������������������������������������������������������������������������������������������������������
27. Statistics & graphics for the laboratory 80 Frequency of measurement and location Frequency: Art. 35. �1. The frequency of control measurements has to be such that it can guarantee a clinically acceptable imprecision. This frequency depends on the characteristics of the method and/or the instrument.
Praktijkrichtlijn
Control rules used for start and for acceptance of a run.
? Frequency: at least 2 IQC events
? Location: at least at start and end
? See also checklist � Frequency and location
Discussion
��������������������������������������������������������������������������������������������������������������������������������������������������������������������������������������������������������������������.�����������������������������������������������������������������������������������������������������������������������������������������������������������
28. Statistics & graphics for the laboratory 81 Stable performance Stable performance
�3. For each new lot, the mean and the SD have to be determined.
?The laboratory has to establish its own stable performance data.
REMEMBER
The target SD (= stable imprecision) is the cornerstone of IQC. It deserves special attention. All instabilities (random and systematic) are compared relative to the stable imprecision.
Recommendation 1
Compare your performance with your colleagues (IQC-"Peer")
Advantages due to the high number of participants
Better IQC-sample
Easier set-up of IQC (more reliable estimates of stable performance)
Easier troubleshooting by direct comparison with �peer�
Recommendation 2
Compare your performance with the data from the manufacturer!
See EXCEL-file for an overview about �state-of-the-art� performance data for the Analyte groups
Ion selective electrode (ISE)
Substrates/Enzymes
Specific proteins
Therapeutic drug monitoring (TDM)
? A list of total and within-run CV data for analyte concentrations in the reference interval (RI) can be found in the EXCEL-file (sorted by biological CVw).
? See also Checklist �stable� imprecision
Note: CV data from concentrations in the RI have been chosen because they will be compared with TEa goals derived from biological variation, which apply to concentrations within the RI.
29. Statistics & graphics for the laboratory 82 Stable performance Discussion
��������������������������������������������������������������������������������������������������������������������������������������������������������������������������������������������������������������������.������������������������������������������������������������������������������������������������������������������������������������������������������������������������������������������������������������������������������������������������������������������������������������������������������������������������������������������������������������������������
30. Statistics & graphics for the laboratory 83 IQC rule selection Generally, IQC rule selection can be done on:
Statistical basis: A rule is chosen based on Pfr and Ped. SD-limits are taken from stable performance.
TEa basis: From a specification for TEa, critical error values can be calculated.
From the critical error values, adequate IQC rules can be selected, naturally, on statistical basis.
Selection tools are: power functions, OPSpecs, critical error graphs, the TEa/CVa,tot ratio; the IQC decision tool
? See also checklists basic statistics; power of control rules; metrology.
Belgian regulation, however �
�3. IQC consists of several procedures which allow, before the release of patient results, to detect all significant within- or between-day variations
Art. 35. �1. � guarantee clinically acceptable imprecision?
What is significant; what is clinically acceptable?
? We need a goal for TEa!
� requires, in principle, IQC rule selection on the TEa basis.
? see also TEa checklist
31. Statistics & graphics for the laboratory 84 Selection of TEa Discussion
��������������������������������������������������������������������������������������������������������������������������������������������������������������������������������������������������������������������.������������������������������������������������������������������������������������������������������������������������������������������������������������������������������������������������������������������������������������������������������������������������������������������������������������������������������������������������������������������������
32. Statistics & graphics for the laboratory 85 Example Selection of the TEa
We select TEa from biology
TEa from the Ricos concept, and
The most stringent TEa, with bottom-line
We apply TEa to manufacturer�s performance
Example
Serum Glucose
Ricos TEa: 6.3%
CVa,tot : 2%
Bias: 0%
Exercise
STT IQC decision tool
EZ Rules selection: NONE with 90%: see OPSpec (note TEa/CVa,tot = 3.2)
Conclusion from the example: It did not work!
? We need a �modified TEa approach�
33. Statistics & graphics for the laboratory 86 Apply the TEa approach (TEa/CVa,tot ratio; the Validator�/EZ rules; IQC decision tool) as evaluation tool for current quality.
Analytes that cannot fulfill the TE specifications
? Decide on the most stringent rule you want to apply (Pfr; n)
Analytes that fulfill TE very easy
? Decide on the most loose rule you want to apply
All others: decide whether you want to use individually optimized rules:
Different rules
Same rule, but movement
Adapt the frequency (less/more measurements)
Problem
Optimization always should consider individual test stability!
Example 1: most stringent rule (left)
Westgard multirule: 13s / 22s / R4s / 41s
n = 4 (required for full power)
Pfr: 3%?Relatively high!
Ped for a 2.5s-shift ~90%
Ped for 3 RE ~90%
Example: the most loose rule (right)
13.5s
n = 4
Pfr: 0,2%; Ped for a 2.5s-shift ~50%
Ped for 3 RE ~70%
NOTE
For what concerns n, the rule can be applied flexible (e.g., n = 1). The modified TEa approach
34. Statistics & graphics for the laboratory 87 Example 2 for the most stringent rule (left)
Westgard multirule: 13s / 22s
n = 4
Pfr: 1%
Ped for a 2.5s-shift ~83%
Ped for 3 RE ~83%
Example for the most loose rule (right)
13.5s
n = 4
Pfr: 0,2%; Ped for a 2.5s-shift ~50%
Ped for 3 RE ~70%
NOTE
For what concerns n, the rule
can be applied flexible (e.g., n = 1).
Note (most stringent rule): The Westgard multirules have been chosen because of their widespread availability in IQC software programmes. When possible, choose others: Think of control rules with variable limits, or mean and variance rules!
We will go further with The modified TEa approach
The modified TEa approach
35. Statistics & graphics for the laboratory 88 IQC rule selection � Process control Basic idea
Independent of using IQC for patient release, we may want to use it for process control!
? For process control, each test could be controlled by the same IQC procedure.
? For process control, higher Pfr values can be accepted. However, Ped should be considerably higher than for patient release.
Examples
Westgard multirules with high n Ped (90%) ~1.8 D SE (see Figure); for the logic of Westgard multirules: lower Figure
Mean and variance rules with high n
Logic scheme for applying the Westgard multirule
36. Statistics & graphics for the laboratory 89 Rule selection Discussion
��������������������������������������������������������������������������������������������������������������������������������������������������������������������������������������������������������������������.������������������������������������������������������������������������������������������������������������������������������������������������������������������������������������������������������������������������������������������������������������������������������������������������������������������������������������������������������������������������
37. Statistics & graphics for the laboratory 90 Selection of IQC rules � Tools & Examples Tools
The ratio of TEa/total-CVa: should be ?4
The STT IQC decision tool
The Westgard software tools (Validator/EZ Rules)
EXERCISES
Sodium
We apply the modified TEa approach, the �most stringent TE� (with bottom-line), and the state-of-the-art CV data
1. Select TEa: Bottom-line: 3.2%
2. Apply the IQC decision tool
- Set stable Bias = 0
- Stable CV (total) = 1%
3. �Sort of analyte?�
4. Apply Validator� for individual rule selection
OUTCOME
The IQC tool and the Validator� show that sodium, with the values chosen, cannot be controlled according to the TEa concept.
The ratio of TEa/total-CVa is 3.2.
Triglycerides
Strategy as before
(see Figures on the right)
TEa: 13.8 (most stringent)
Bias: 0%
CVa,tot: 1.7%
Ratio TEa/CVa,tot: 8.1
OUTCOME
The IQC tool and the Validator� show that, even with the most stringent TEa, triglycerides can be controlled easily with the TEa concept:
The Validator� selects the 13.5s rule (n = 2)
NOTE
In the EXCEL-file, you find for ISE, substrates, enzymes, specific proteins, TDM a list of
CVw, CVb
TE for IQC decision
Ricos et al.
State-of-the-art CV data
38. Statistics & graphics for the laboratory 91 IQC rule selection � Applications First, we screen the analytes with the Ricos-TEa/CVa,tot ratio
The tables show analytes with ratios <4 (full list in EXCEL-file).?In principle, the most stringent IQC rule should be applied for all these analytes.
Example: 13s/22s (n = 4)
Note on low TEa/CVa,tot ratios
Low TEa/CVa,tot ratios are usually associated with analytes that have narrow biological variation.
Current state-of-the-art technology is unable to reach the goals for these analytes. This holds true for all companies.
39. Statistics & graphics for the laboratory 92 IQC rule selection � Applications The tables below show analytes with ratios ?4 (full list in EXCEL-file).
?In principle, individually optimized IQC rules can be applied for all of these analytes (note: most loose = 13.5s).
Now, we will apply the STT IQC decision tool for some analytes with ratios from 4-7.
APO A1 (4,3): TEa: 9.1 CVa,tot: 2.1
a-1-Antitrypsin (5,1) TEa: 9.2 CVa,tot: 1.8
IgA (6,8) TEa: 13.5 CVa,tot: 2.0
We observe: from ratios >~5-6, IQC should be relatively easy!
We verify this with the EZ rules (note: fill in all fields; if appropriate, use dummy values).
40. Statistics & graphics for the laboratory 93 IQC rule selection � Applications Excercises with the EZ rules, using the specific protein examples (ratios from ~4-7).
Note: all fields must be filled in (may be dummy values)!
Selection criteria: 2 materials, SE detection 90%
APO A1 (4.3) Rule: 12.5s n=4 Pfr: 4%
a-1-Antitrypsin (5.1) Rule: 13s/ 22s n=2 Pfr: 1%
IgA (6.8) Rule: 13.5s n=2 Pfr: <0.1%
Example (6) Rule: 13.5s n=2 Pfr: <0.1%
Observation: from ratios >6, the process can be controlled very easy! ? 6 sigma process
We take the 13.5s (n=4) rule for all analytes with a TEa/CVa,tot ratio ?6
41. Statistics & graphics for the laboratory 94 IQC rule selection � Applications Screening with the Ricos-TEa/CVa,tot ratio: all ?4 - <6
The table shows examples where optimized rules could be used. However,
Consider: Is it worth?
Should one use the most stringent IQC rule?
REMARK
Remember process control.
One stringent rule could be used for all analytes.
42. Statistics & graphics for the laboratory 95 VARIA Calculation of an actual TE
Rule �n� and patient release
Dealing with a bias
Rules with wide limits (e.g. 6s) & lot variations
�Fine-tuning� of IQC according to instability
Calculation of an actual TE
When actual performance does not satisfy the TEa requirement, and one selects the most stringent rule, one can calculate (or extract with EZ rules) the real TE for the actual performance and the rule chosen.
Examples, IQC rule 13s/22s (n = 4)
CVa Ricos TEa Real TE
(%) (%) (%)
Chloride: 1.0 1.5 ~4.3
Albumin: 1.2 3.9 ~5.2
Calcium: 2.0 2.4 ~8.6
Note: with this rule (without bias), actual TE = 4.3 � CVa
Rule �n� and patient release
When IQC rules with higher number of n are selected, and IQC measurements are done continuous, patient release has to be postponed until the full power of the rule is reached (cumulation needed).
However, at the end of the day, cumulation is not possible anymore. Consequently, it may be required to increase the frequency of measurement per IQC event (1 = usual, 2 = last but two, 3 = last but one, 4 = final event).
This is not necessary when block measurement is performed.
Dealing with a bias
It is not recommended to work with the bias in the QC chart:
? Increases Pfr
Bias should be addressed during rule selection via TEa.
A bias will require more stringent IQC rules.
43. Statistics & graphics for the laboratory 96 VARIA IQC rules with wide limits (e.g. 6s) and lot variations
When rules with wide limits are used, significant lot-to-lot variations may be recognized in the chart, but may not cause rule violations (see Figure below).
Decide about
the medical relevance of the variations
whether you want to pick them up by the process control
whether you address them with quality assurance means.
Note: Similar may happen when you overestimated CVa (for example, high CVa,tot/CVa,w ratios).
�Fine-tuning� of IQC according to type of instability
Steadily increasing
Abrupt changes
Fluctuating
Intermittent (sporadic)
IQC is strong in detecting steadily increasing instability or abrupt changes. This, in particular, when patient release can be postponed until the IQC procedure reaches its full power. Namely, after error detection and correction, patient samples can be remeasured.
IQC is weak in detecting fluctuating or intermittent (sporadic) instability. This the more, the less IQC measurements are performed.
�Fine-tuning� of IQC according to instability requires in-depth knowledge about the weak points of the analytical process (error frequency; expected error types).
�Fine tuning� may consider:
IQC sample concentration
Rule selection
Frequency of measurement
Location (block or continuous)
44. Statistics & graphics for the laboratory 97 Varia Discussion
��������������������������������������������������������������������������������������������������������������������������������������������������������������������������������������������������������������������.������������������������������������������������������������������������������������������������������������������������������������������������������������������������������������������������������������������������������������������������������������������������������������������������������������������������������������������������������������������������
45. Statistics & graphics for the laboratory 98 Remedial actions EXCERCISES
Inspecting IQC charts
Note in advance: �When results of controls fail to meet the laboratory's established criteria for acceptability, all patient test results obtained in the unacceptable run must be evaluated to determine if patient results have been adversely affected and the laboratory must take remedial actions to ensure the reporting of accurate and reliable patient test results�
�Westgard philosophy� (Basic QC Practices)
Don�t simply rerun the control
Don�t simply �try a new bottle�
? Identify the problem (inspect the chart) and correct it
Which type of error (concentration dependent, SE, RE)
Relate the error to a potential cause
Consider common factors (temperature; pipetting: volumes; kind of test: kinetic/endpoint; wavelength)
Relate to recent changes (operator, calibration, reagent, IQC-material, maintenance, etc.)
Demonstrate and document that the error was fixed
Run controls after fixing the problem
Acceptability limits
46. Statistics & graphics for the laboratory 99 Pfr of the IQC rule and frequency of remedial actions When you compare your actual short-to-medium term frequency of remedial actions with the Pfr you expect from the IQC rule, consider the nature of the CVa,tot you chose. The more variations you included, the lower the frequency of remedial actions will be.
If actual remedial actions frequency << rule Pfr
Consider to pick up certain variations by IQC
? Consequence: reduces your CVa,tot that you use for IQC
? May allow a different rule when the TEa concept was used.
Consider that you used a wrong CVa,tot
The �state-of-the-art� example
We have ~40 analytes with the rule 13s/22s, Pfr: 1% (n = 4), ~30 analytes with the rule 13.5s, Pfr: 0,2% (n = 4), and assume 8 IQC measurements per day. Then,
? we expect ~80% chance for a false rejection
? Under stable conditions, we expect at maximum 1 remedial action per day,
More, if system is unstable
Less, if Cva,tot > CVa short-to-medium term.
CVa,tot /CVa,w ratio
Note: Troubleshooting is facilitated by increased CVa,tot /CVa,w ratios.
47. Statistics & graphics for the laboratory 100 Remedial actions Note: Either the measurement procedure or the control procedure can be faulty.
Release of patient results
You suspect the QC sample was the reason for failure
Take a new bottle.
Remeasure with n = 4, for example. If the IQC rule is not violated, assume the IQC sample caused the problem.
However, realize the uncertainty of your estimate!
?Keep an eye on the process for a while.
You suspect a calibration problem
Recalibrate the system, however, document the post-calibration status by a sufficient number of control measurements (for example: 4).
The system is under control again when the IQC rule is not violated. However, realize the uncertainty of your estimate!
Remeasure the patient samples between the last in-control event and the out-of-control event.
Compare the mean of the new patient results with that of the old results. When there was a calibration problem, this should be reflected in the difference of both means.
You suspect other problems
Look at patient data
Investigate all IQC levels (= IQC across materials), check other analytes (= IQC across analytes).
Investigate related analytes (e.g., all enzymes: could be temperature related).
Compare the actual CV with the expected one, and compare the IQC results with appropriate IQC-"Peer" (EQA) data.
Look at �electronic� QC data.
Check instrument (maintenance), reagents, operator change.
Locate and fix the problem and document that the problem was solved (perform IQC).
Remeasure the patient samples between the last in-control event and the out-of-control event.
Compare the mean of the new patient results with that of the old results. When there was an SE problem, this should be reflected in the difference of both means.
48. Statistics & graphics for the laboratory 101 Remedial actions Process control
Rules with higher Pfr (e.g. 2.5s, Westgard multirules, or others) can be used for closely monitoring the analytical process.
In case that these rules are violated, patient results can still be reported. However, when time, the analytical process (calibration, reagent, instrument) or the IQC material should be investigated.
Possibilities
Look at patient data
Check �electronic� QC data
Investigate all IQC levels (= IQC across materials), check other analytes (= IQC across analytes).
Invstigate related analytes (e.g., all enzymes: could be temperature related).
Compare the actual CV with the expected one, and compare the IQC results with appropriate IQC-"Peer" (EQA) data.
When necessary, recalibrate the system and check the success of recalibration as described above.
Check instrument (maintenance), reagents, operator change.
In general, trouble-shooting should be done with an increased number of control measurements, however, higher CVa,tot/CVa,w ratios facilitate troubleshooting.
Over the time, check the success of your remedial actions.
CAUTION
The described strategy is an extremely simplified one.
In practice, problems have a great variety of origins and require different trouble-shooting strategies (�mans phantasy is too limited to imagine beforehand what the problem might be�).
Only an experienced analyst will be able to solve serious problems in a reasonable time.
? System experience is invaluable!
49. Statistics & graphics for the laboratory 102 Remedial actions Discussion
��������������������������������������������������������������������������������������������������������������������������������������������������������������������������������������������������������������������.������������������������������������������������������������������������������������������������������������������������������������������������������������������������������������������������������������������������������������������������������������������������������������������������������������������������������������������������������������������������
50. Statistics & graphics for the laboratory 103 Internal Quality Control General discussion
��������������������������������������������������������������������������������������������������������������������������������������������������������������������������������������������������������������������.������������������������������������������������������������������������������������������������������������������������������������������������������������������������������������������������������������������������������������������������������������������������������������������������������������������������������������������������������������������������
51. Statistics & graphics for the laboratory 104 Reminders Reminder 1
Troubleshooting should be done with replicates!
Reminder 2
Don�t forget proactive quality assurance
A new lot (bottle) of IQC material is introduced
The operator changed
Instrument was calibrated or underwent major maintenance
New lots (bottles) of reagents or calibrators
Overall summary
The guiding rule (regulation)
Knowledge
Basic statistics
Power functions
TE error concept (metrology)
TEa (critical errors, specifications)
Selection of TEa values (and problems)
IQC Software
Additional: rule selection tools
Adequate samples (sort, targets, concentration)
Adequate frequency (and location) policy
Cost/benefit calculations
Instrument stability data & test stability & reproducibility data
Stable performance: Compared to manufacturer/peers
Integrated rule selection (TEa; statistics; costs)
Distinguish: Release of patient data/Process control
Remedial actions policy
Distinguish: Release of patient data/Process control
Compare expected Pfr with actual rejection rate
Investigate success rate
Integration of IQC in the overall quality management
Dedicated personnel