Download
1 / 3
30 likes | 43 Views
Market timing models indicate a poor return vs risk potential with a near-term sell signal suggesting a cautious stance on the market heading into the fall.

E N D
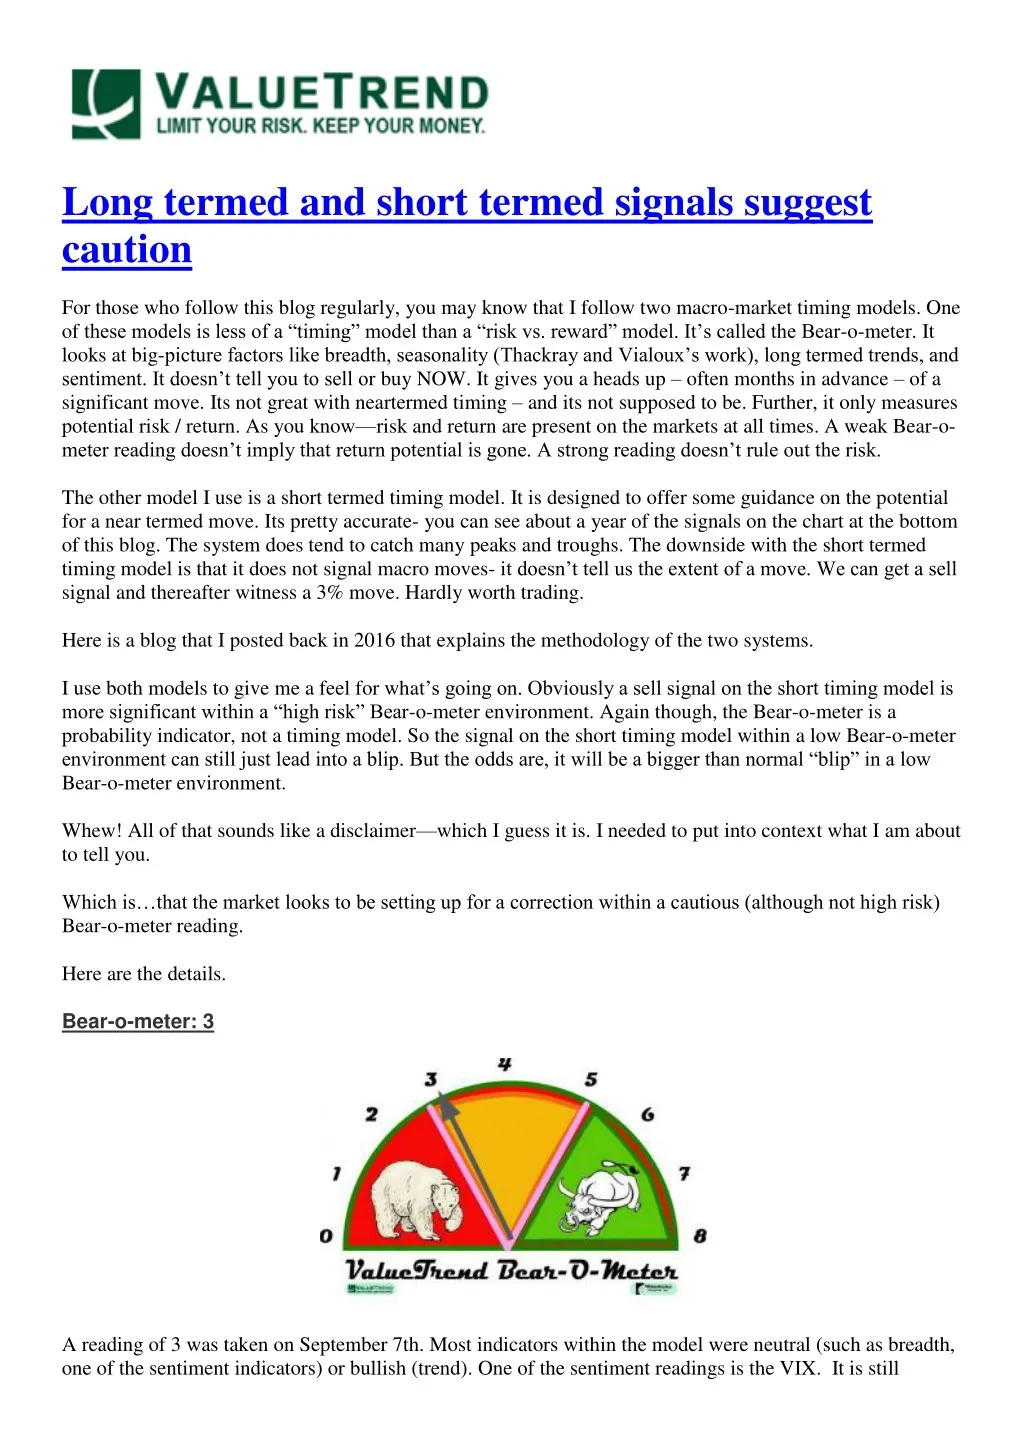
Long termed and short termed signals suggest caution For those who follow this blog regularly, you may know that I follow two macro-market timing models. One of these models is less of a ―timing‖ model than a ―risk vs. reward‖ model. It’s called the Bear-o-meter. It looks at big-picture factors like breadth, seasonality (Thackray and Vialoux’s work), long termed trends, and sentiment. It doesn’t tell you to sell or buy NOW. It gives you a heads up – often months in advance – of a significant move. Its not great with neartermed timing – and its not supposed to be. Further, it only measures potential risk / return. As you know—risk and return are present on the markets at all times. A weak Bear-o- meter reading doesn’t imply that return potential is gone. A strong reading doesn’t rule out the risk. The other model I use is a short termed timing model. It is designed to offer some guidance on the potential for a near termed move. Its pretty accurate- you can see about a year of the signals on the chart at the bottom of this blog. The system does tend to catch many peaks and troughs. The downside with the short termed timing model is that it does not signal macro moves- it doesn’t tell us the extent of a move. We can get a sell signal and thereafter witness a 3% move. Hardly worth trading. Here is a blog that I posted back in 2016 that explains the methodology of the two systems. I use both models to give me a feel for what’s going on. Obviously a sell signal on the short timing model is more significant within a ―high risk‖ Bear-o-meter environment. Again though, the Bear-o-meter is a probability indicator, not a timing model. So the signal on the short timing model within a low Bear-o-meter environment can still just lead into a blip. But the odds are, it will be a bigger than normal ―blip‖ in a low Bear-o-meter environment. Whew! All of that sounds like a disclaimer—which I guess it is. I needed to put into context what I am about to tell you. Which is…that the market looks to be setting up for a correction within a cautious (although not high risk) Bear-o-meter reading. Here are the details. Bear-o-meter: 3 A reading of 3 was taken on September 7th. Most indicators within the model were neutral (such as breadth, one of the sentiment indicators) or bullish (trend). One of the sentiment readings is the VIX. It is still
reading at higher risk (bearish) level –although it’s been there for quite some time. Note that the VIX has a history of staying at the low extreme for many, many months – even a few years. It has been accurate in signalling eventual selloffs, albeit way ahead of time! The long termed VIX chart below shows a good signal ahead of the 1997-98 Asian Contagion (Russia near bankruptcy, etc) selloff. The VIX wasn’t at the lows before the 1999 tech peak and subsequent crash –so no signal there. I think that’s because the tech stocks commanded a higher option premium in the late 1990’s for the excitement surrounding them. The VIX normally tries to read complacency vs. fear. But any form of volatility – even one passed on positive expectations –can increase option premiums to abnormal levels. The VIX isn’t as good a contrarian sentiment indicator in that environment. Note that the VIX did provide good buy signals (green pessimism line) after the 1998, 2001, 2008, 2011 and early 2016 market selloffs. Note the shorter termed chart of the VIX below does show you that the indicator sits at around 10 right now. I view anything below 12 as a negative point within the Bear-o-meter.
So…. we have a low-neutral to cautious reading on the Bear-o-meter macro risk compilation—right on the line between neutral and high risk. This suggests holding stocks, but also holding some cash. It’s not a ―run for the hills‖ environment. But it’s not a ‖sell the farm and buy stocks‖ environment either. Far from it. Short termed timing signal: “Sell” In order for a buy or sell signal to be initiated on the short termed timing model, you need all three indicators on the chart below to reach their respective overbought/ oversold levels. In a nutshell: A sell is signalled by a concurrent overbought signal on RSI, overbought signal on Stochastics, and touch of the upper Bollinger Band. A buy is signalled by an oversold signal on Stochastics and RSI and a lower Bollinger Band test. Ideally, a hook from all three would occur before acting on a signal. Further, keep in mind that nothing is guaranteed to work, and you might get a false signal. Finally, the extent of a move might be minimal and not worthy of a trade—something you can’t measure ahead of time. The chart above shows us the makings of a sell signal right now. History of the system over the past 1.5 years can be seen by the red vertical lines line up the sell signals, and the green vertical lines line up the buy signals. Of note: The deeper the RSI or Stochastics signal, the better. They’re reasonably deep (overbought) now. All things being equal, its a good “sell” setup. Traders should wait for a hook. Conclusion We are in a macro environment of poor return vs. risk potential according the Bear-o-meter.We have a near termed sell signal, or close to it (wait for the hook to make it official) on the short termed timing model.All in, it may be wise to maintain a cautious stance at this point. There may be a buying opportunity approaching. Read more - http://www.valuetrend.ca/long-termed-short-termed-signals-suggest-caution/