Download
1 / 21
210 likes | 297 Views
National WAP Evaluation: Indoor Environmental Quality Field Study Findings. Scott Pigg Energy Center of Wisconsin Bruce Tonn Oak Ridge National Laboratory David Carroll APPRISE. Presentation Overview. Purpose Field Study Design Pre Weatherization Findings

E N D
National WAP Evaluation: Indoor Environmental Quality Field Study Findings Scott Pigg Energy Center of Wisconsin Bruce Tonn Oak Ridge National Laboratory David Carroll APPRISE
Presentation Overview • Purpose • Field Study Design • Pre Weatherization Findings • Pre/Post Thermostat Behavior Findings
Purpose in Context • Impact evaluation • Program characterization • Energy and cost savings • Cost effectiveness • Non-Energy impacts • Indoor environmental quality study • Occupant survey
Specific Information Goals • Carbon Monoxide – A series of measurements of different sources of CO in the home • Radon – Short term measurement of radon levels for the first floor and foundation level • Formaldehyde – Short term measurement of formaldehyde concentrations in living space • Temperature and Humidity – Longer term measurement of temperature and humidity at the central thermostat • Moisture Assessment – Visual inspection of above grade and foundation level moisture issues
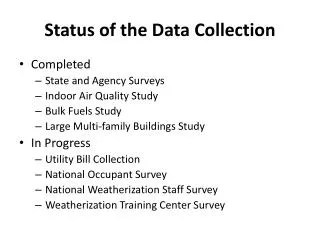
Field Study Procedures • Sample – 88 agencies in 35 states • 325 treatment and 189 control single family homes • Time Period • Heating season field period: November 2010 - March 2011 • Cooling season field period: June 2011 - August 2011 • Testing – Housing unit diagnostics and combustion appliance tests • Monitoring • Short term – 7-day radon and 7-day formaldehyde samplers • Longer term – CO, temperature, humidity data loggers
Field Study Sample Winter sample Summer sample Radon stratum Map boundaries are Census 2000 super-PUMAs low mid high very high
Field Study Visits • Visit #1 – Post Audit / PreWX (11/10 through 1/11) • PreWx diagnostic testing, instrumentation, placement of samplers • Visit #2 – Visit #1 + 7 Days • Retrieval of radon and formaldehyde samplers / conduct occupant survey • Visit #3 – 30 days PostWX • PostWX diagnostic testing and placement of samplers • Visit #4 – Visit #3 + 7 Days • Retrieval of radon and formaldehyde samplers and data loggers
Carbon Monoxide • Heating Systems • Central fuel fired system in 75% of homes; 40% atmospherically vented • Small percentage with inadequate draft (< 10%) • Small percentage with high CO production (<10%) • Water Heaters • About 20% incidence of atmospheric water heaters with marginal drafts • Higher incidence for measurements during warm weather • Only 1 in 200 water heaters had high CO production
Carbon Monoxide - continued • Ambient CO Levels • Ambient CO levels never exceeded 5 ppm for about two-thirds of homes. • About one in ten homes had one or more episodes of CO elevation that peaked at 20 ppm or higher prior to weatherization (the highest was ppm). • A small percentage of homes (5%) exhibited persistent low-level CO.
Radon • The study data indicate that 12% ±2 of single-family homes treated by the program have pre-weatherization radon levels are above the EPA guideline level of 4 pCi/l. In a few states, this fraction likely exceeds 25 percent of homes. • The study confirms that elevated radon is relatively rare in mobile homes and site-built homes in counties identified by EPA as having low radon potential. • Note: Evaluation funding is being used to remediate homes that were measured to exceed the EPA guideline.
Formaldehyde • Formaldehyde levels were measured on the first floor above grade for a sub-sample of 145 homes • The average program home has a pre-weatherization indoor formaldehyde concentration of 14 ± 1 ppb, and most homes tested below 30 ppb. • Mobile homes may have higher formaldehyde levels than site-built homes, and weatherization may have a larger impact on these levels, but the available sample precludes solid conclusions.
Humidity and Moisture Issues • Program homes tend to be on the dry side during the heating season: nearly half (44 ± 5%) have wintertime relative humidity below 30 percent, but ten percent or fewer (6 ± 4%) has relative humidity above 50 percent. • Fewer than 35% of foundations and 40% of above-grade spaces had observed moisture problems. • Water stains were the most common observed moisture problem in both foundations and above-grade spaces. About three in ten above-grade spaces had water stains and about one fifth of foundations had water stains. • •
Temperature – PreWX Findings • Wintertime indoor temperatures in program homes average 70.3 ± 0.5F, but range from less than 60F to more than 80F. • Households that showed evidence of practicing thermostat setback have indoor temperatures that average 3.0 ± 0.7F lower than households that do not practice setback prior to weatherization. • One quarter to one third of single-family program homes have a programmable thermostat prior to weatherization; temperatures average 1.5 ± 0.5F lower than in homes with a manual (or no) thermostat.
One in four households showed evidence of thermostat setback before Weatherization Households that practice setback average 3.0 ± 0.5 F lower indoor temperature 4084-I22 3370-I22
Conclusions • This study measured a slight increase in indoor temperature associated with weatherization (0.27 degrees). • One source of the change in indoor temperature could be that weatherized homes cool more slowly when temperatures drop or thermostats are set back. • This study only addresses the potential for short-run behavior change, not the long-run. • The study findings suggest that there is no short-term “take back” effect from weatherization.