Download
1 / 32
320 likes | 434 Views
Economic perspectives Charts Address by Governor Svein Gjedrem at the meeting of the Supervisory Council of Norges Bank on Thursday, 15 February 2007. Chart 1 Mainland GDP Annual growth. Per cent. Sources: Statistics Norway and Norges Bank. Chart 2 Terms of trade Index. 2000=100.

E N D
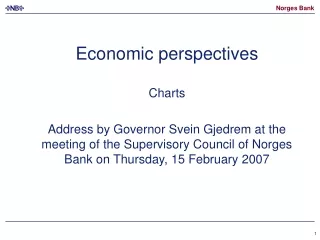
Economic perspectivesChartsAddress by Governor Svein Gjedrem at the meeting of the Supervisory Council of Norges Bank on Thursday, 15 February 2007
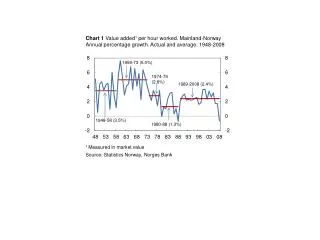
Chart 1 Mainland GDPAnnual growth. Per cent Sources: Statistics Norway and Norges Bank
Chart 2 Terms of tradeIndex. 2000=100 Sources: Statistics Norway and Norges Bank
Chart 3 Foreign workers on assignments in Norway Source: Central Office - Foreign Tax Affairs
Chart 4 Productivity growth in the business sectorPer cent Sources: Statistics Norway and Norges Bank
Chart 5 Short-term real interest ratePer cent Interval for neutral real interest rate Source: Norges Bank
Chart 6 Capacity utilisation in manufacturing Per cent Average 2006 Source: Statistics Norway
Chart 7 Inflation and capacity utilisation Per cent Projections Inflation Capacity utilisation Sources: Statistics Norway and Norges Bank
Chart 8 Registered unemploymentPer cent Source: Norwegian Labour and Welfare Organisation (NAV)
Chart 9 Norges Bank's key rate1)Per cent 1) Projections from Inflation Report 3/06 Source: Norges Bank
Chart 10 InflationMoving 10-year average. Per cent Inflation target Sources: Statistics Norway and Norges Bank
Chart 11 Periods of rising house pricesNumber of years and total percentage increase. 1819-2006 14 years 11 years 18 years 12 years 9 years 14 years Sources: Statistics Norway and Norges Bank
Chart 12 Total increase in real house prices At end-2005. Per cent Sources: Paul van den Noord (2006) OECD, Statistics Norway and Norges Bank
Chart 13 House prices and disposable incomeAnnual change. Average 1999 -2005 UK Spain France Australia Norway Sweden Real house prices US Germany Japan Real disposable income Sources: OECD, Reuters EcoWin, Statistics Norway and Norges Bank
Chart 14 Household saving and net lendingPercentage of disposable income Saving Net lending Sources: Statistics Norway and Norges Bank
Chart 15 Long-term interest ratesPer cent US Norway Source: Reuters EcoWin
Chart 16 Population structure Number of households Growth Numbers in densely populated areas Per cent of total population Sources: Statistics Norway and Norges Bank
Chart 17 Household debtPercentage of disposable income Netherlands Denmark Norway UK Sweden Sources: OECD, Office for National Statistics (ONS), Sveriges Riksbank, Danmarks Nationalbank, BIS and Norges Bank
Chart 18 House prices in NorwayReal rise and fluctuations. Per cent Real rise Fluctuations Sources: Statistics Norway and Norges Bank
Chart 19 Actual and simulated house priceIn thousands of NOK per square meter Actual house price Simulated house price Sources: Norges Eiendomsmeglerforbund, Eiendomsmeglerforetakenes forening, FINN.no, ECON og Norges Bank
Chart 20 Periods of falling house prices Number of years and total percentage decline. 1819-2006 5 years 4 years 11 years 7 years 7 years 2 years Sources: Statistics Norway and Norges Bank
Chart 21 GDPAverage growth. Per cent Sources: Groningen Growth and Development Centre and Norges Bank
Chart 22 Productivity growthPer cent Nordic countries and EU15 Average 1995 -2005 Norway Mainland Norway, total Total Services and retail trade Sources: OECD, Groningen Growth and Development Centre, Statistics Norway and Norges Bank
Chart 23 Inflation and unemployment Per cent Inflation Unemployment EU15 EU15 Nordic countries Nordic countries Sources: Reuters EcoWin, OECD and Norges Bank
Changes in the economic system • Division of responsibility in economic policy • Trade policy • Tax system • Financial and credit markets
Chart 24 Start ups in the service sectorPer cent of existing enterprises. Average 1998 -2001 Source: Eurostat
Chart 25 Female labour force participation Per cent Nordic countries Norway EU15 Sources: OECD and Norges Bank
Chart 26 Persons on benefit and early retirement schemes Number of persons. 1995 – 2005 Early retirement schemes Vocational rehabilitation Sickness benefits Rehabilitation Disability schemes Source: Norwegian Labour and Welfare Organisation (NAV)
Chart 27 CO2 emissionsIn billions of tonnes Asia and Oceania North America Europe Eurasia Source: Energy Administration Information (EIA)
Chart 28 Global mean temperatureTrend and deviation from average 1951 – 1980, ºC Source: NASA – Goddard Institute for Space Studies