Download
1 / 29
290 likes | 360 Views
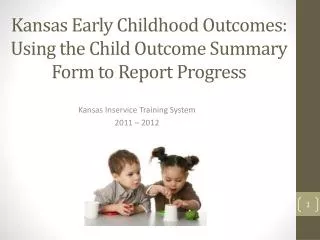
The Results are In! Child Outcomes for OSEP EI and ECSE Programs. Donna Spiker Early Childhood Outcomes Center at SRI International. October 13, 2011 ( CCSSO-SCASS Meeting) San Francisco, CA. What we will cover. Quick review of the reporting requirement and state approaches

E N D
The Results are In! Child Outcomes for OSEPEI and ECSE Programs Donna Spiker Early Childhood Outcomes Center at SRI International October 13, 2011 (CCSSO-SCASS Meeting) San Francisco, CA
What we will cover • Quick review of the reporting requirement and state approaches • Share the national data • Describe how the national data were computed • Discuss the quality of the national data • Discuss next steps for states • Framework and self-assessment (briefly. …) Early Childhood Outcomes Center
OSEP Reporting Requirements: Child Outcomes • Positive social emotional skills (including positive social relationships) • Acquisition and use of knowledge and skills (including early language/ communication [and early literacy]) • Use of appropriate behaviors to meet their needs Early Childhood Outcomes Center
OSEP Reporting Categories Percentage of children who: a. Did not improve functioning b. Improved functioning, but not sufficient to move nearer to functioning comparable to same-aged peers c. Improved functioning to a level nearer to same-aged peers but did not reach it d. Improved functioning to reach a level comparable to same-aged peers e. Maintained functioning at a level comparable to same-aged peers 3 outcomes x 5 “measures” = 15 numbers Early Childhood Outcomes Center
The Summary Statements • Of those children who entered the program below age expectations in each outcome, the percent who substantially increased their rate of growth by the time they turned 3 years of age or exited the program. • The percent of children who were functioning within age expectations in each outcome by the time they turned 3 years of age or exited the program. Early Childhood Outcomes Center
Note: Based on 29 States with highest quality data Early Childhood Outcomes Center
Note: Based on 29 States with highest quality data Early Childhood Outcomes Center
Note: Based on 33 States with highest quality data Early Childhood Outcomes Center
Note: Based on 33 States with highest quality data Early Childhood Outcomes Center
Criteria for States with Quality Data • Low percentage of missing data • No odd patterns in “a” or “e” categories • Did not use questionable data collection methods Early Childhood Outcomes Center
Problem with Missing Data • We don’t know how well the data the state has represent the entire state. • If the data are representative, the percentages for the a to e Progress Categories and the Summary Statements won’t change as data are added on more children. Early Childhood Outcomes Center
Can we trust these data? Early Childhood Outcomes Center
Pattern checking for validity • Checking across years • How do the 2009-10 compare to the data for 2008-09? • Checking across methods • How do the data for all states compare to states with highest quality data? Early Childhood Outcomes Center
What do these data tell us? • Nationally, a high proportion of children who receive Part C and ECSE services are showing greater than expected progress. • Nationally, many (over half) are exiting the program functioning like same age peers in at least one of the outcomes. Early Childhood Outcomes Center
Using data at state level…… • Never intended to compare states • OSEP wants states to begin by comparing own data to past data • States set targets to compare yearly performance to those targets • States implement program improvement activities • OSEP looking at data in monitoring visits Early Childhood Outcomes Center
Linkages to other state EC efforts…… • Some states are beginning to develop linkages between these OSEP data and other assessment in their states, for example: • Colorado’s Results Matter • Results Matter in Nebraska • Kentucky Early Childhood Data System (KEDS) Early Childhood Outcomes Center
Colorado’s Results Matter Early Childhood Outcomes Center
Supporting States in Building a Child Outcomes Measurement System (just briefly………)
Framework and Self-Assessment • Framework • Set of components and quality elements • Provides the structure for the self-assessment • Self-assessment • Scale that provides criteria for levels of implementation within each quality element • Rating assigned based on level of implementation within each element Early Childhood Outcomes Center
Additional Information & Questions Additional information: www.the-eco-center.org Questions Early Childhood Outcomes Center