Download
1 / 36
360 likes | 449 Views
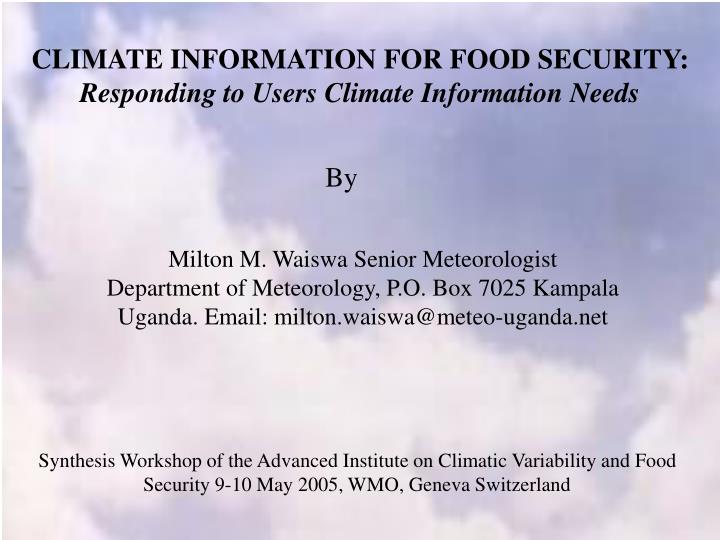
CLIMATE INFORMATION FOR FOOD SECURITY: Responding to Users Climate Information Needs. By. Milton M. Waiswa Senior Meteorologist Department of Meteorology, P.O. Box 7025 Kampala Uganda. Email: milton.waiswa@meteo-uganda.net.

E N D
CLIMATE INFORMATION FOR FOOD SECURITY:Responding to Users Climate Information Needs By Milton M. Waiswa Senior Meteorologist Department of Meteorology, P.O. Box 7025 Kampala Uganda. Email: milton.waiswa@meteo-uganda.net Synthesis Workshop of the Advanced Institute on Climatic Variability and Food Security 9-10 May 2005, WMO, Geneva Switzerland
Research Team MR. MILTON WAISWA, Senior Meteorologist Department of Meteorology, Kampala, Uganda. MR. PETER MULAMBA, Lecturer for Climatology), Faculty of Agriculture, Makerere University, Kampala, Uganda MR. ISABIRYE PAUL, Principal Meteorologist Department of Meteorology, Kampala, Uganda. Dr. Jenipher Philips, Professor, Bard College, New York USA Research financially supported by START/IRI /Packard Foundation
What is the problem? Start of seasonal rainfall varies from year to year, either being early, in time or late
What is the current scientific solution Expected features of a basic climate forecast on seasonal rains First question from a farmer When should we plant? When are rains beginning?
Current Rural Development Paradigm “ building (Gorjestani 2000) on indigenous knowledge can be particularly effective in helping to reach the poor since indigenous knowledge is often the only asset they control, and certainly one with which they are very familiar” “ Providing farmers with needed climate information through linking indigenous and scientific climate knowledge systems.”
Characteristics of targeted farmers Agriculture in Developed World Subsistence Agriculture in Developing World(Uganda)
Objectives of Research Identify details of how farmers traditionally uses local temperatures and winds to forecast onset of first rains; Validate the indigenous rainfall indicators for onset of first rains Develop statistical models for forecasting of first rains
Methodology of Research Identification of usage was achieved through conducting individual and group surveys of farmers in Eastern (Tororo), Lake Victoria basin (Jinja), Central (Wakiso) and Western (Masindi) Uganda. Validation of indigenous rainfall indicators is based on the climate data from synoptic weather stations in the four regions. Model development was achieved by statistical linear regression of validated temperature indicators with rainfall onset dates formatted in pentads.
Sources of Data for Analysis The indigenous meteorological knowledge of farmers. In order to capture this data, a field survey was conducted using a questionnaire that interviewers used to ask farmers about their knowledge related to local meteorological issues. The second type of data was historical meteorological data acquired from the weather stations within the survey areas.
Results: Planting Time Indicators Determining the right planting time Apart from Tororo, the main criteria farmers in these regions, use to determine the right time for planting their crops is when the rains start, and following the calendar months (Table 3.2.1). At the onset of the rains, the farmers, wait for at least 2-3 showers then they consider planting their seeds. However the onset of rains should be within the expected months for planting.
Results: Indicators for onset of rains Major rainfall indicators farmers’ use to forecast onset of first rains (March-May) The main 5 rainfall indicators farmers use to forecast rains are winds, temperatures, clouds, birds and trees. The winds, temperatures and clouds are common atmospheric elements observed by both meteorologists and farmers. However meteorologists document their records on different mediums like paper and computer, which can felicitate follow up analysis.
Month Masindi Wakiso Jinja Tororo December 23 2 9 15 January 49 8 33 34 February 64 49 45 85 March 64 12 18 60 Appearance of Indicators Local Winds indicators The winds used for rainfall forecasts mostly appear in the month of February followed by March. At times the winds appear in December and January. This means that these indicators can be used to forecast onset of first rains using mainly the month of February
Month Masindi Wakiso Jinja Tororo December 26 0 5 13 January 51 17 23 20 February 66 51 40 78 March 46 20 16 55 Appearance of indicators Indicator: Local increase in temperatures The occurrence of these temperature conditions is mainly in the month of February. This suggests that the temperature conditions in February could be used to forecast onset of first rains.
Operational use of indicators The change of wind direction and speed, are important features, farmers use to forecast seasonal rains. During dry season the wind blow in a particular direction and as the rainfall season is about to begin, the wind direction changes.
Operational use of indicators How farmers use local temperatures The majority of farmers use the increase in temperatures during a dry season as signals for early onset of first rains
Rainfall Season Survey Sites Masindi Wakiso Jinja Tororo 1st season 79 71 91 93 2nd season 20 8 1 6 Both seasons 14 1 Which season is easier to forecast The Table above reveals that the majority of farmers find it easier to forecast the first rains than the 2nd seasonal rains.
Survey Summaries The direction and speed of winds at a point of time during the dry season are signals related to when the wet season is likely to start. The increase in local temperatures during a certain period of the dry season signals when the wet season is likely to start.
Farmers Interest % Know the right planting time 36 Learn how to forecast rains 22 Advise on rainfall forecasts 14 Why changes in rainfall seasons 7 Using rainfall forecasts 3 Attend weather forecast seminars 2 Summary Survey findings Farmers interests to learn from a meteorologist
Data set P 0.05 P 0.001 30 0.360 0.460 25 0.390 0.500 20 0.440 0.570 15 0.510 0.640 10 0.630 0.760 Key Approaches for Validation. Format onset dates based on Julian Calendar Use recent weather data(1990-2002) With limited Data set use high significant correlation values
Temperatures and onset dates Statistical relationship between historical onset dates with average 5 day temperatures of the dry season pre the first wet season(March-May)
Regression: Masindi Masindi linear model estimation ------------------------------------------ Multiple R 0.932 R Square 0.869 Adjusted R Square 0.853 Standard Error 7.232 356y = 16.297x - 393.673
Regression: Namulonge Namulonge linear model estimation -------------------------------------------- Multiple R 0.909 R Square 0.827 Adjusted R Square 0.805 Standard Error 4.285 319y = -10.425x + 353.115
Regression: Jinja Jinja linear model estimation ----------------------------------------- Multiple R 0.751 R Square 0.563 Adjusted R Square 0.509 Standard Error 8.926 307y = 12.149x - 274.021
Regression: Tororo Tororo linear model estimation -------------------------------------- Multiple R 0.723 R Square 0.523 Adjusted R Square 0.463 Standard Error 7.452 7y = 3.889x – 62.967
Conclusion The above study reveals, the practices that farmers and meteorologist have in common in observing atmospheric conditions in pursuit to forecast seasonal rains for crop production. There are also differences in the way both farmers and meteorologists observe and range climate scenarios each group can forecast. The farmer’s effort of forecasting rains using their rainfall indicators highlights the importance of climate forecasts to them to ensure food security.
Conclusion The challenges farmers experience in producing and using climate forecasts is a development activity very critical needed by meteorologists to address. Through studying the indigenous climate knowledge systems, meteorologists can identify the priority climate information needed by farmers. While the farmers, can use the increasing temperature at night during the dry season, to forecast onset of first rains. The models may be used to forecast the onset of the first rains 2-3 months in advance compared to farmer's traditional methods of just a few days.
Recommendations Meteorologists practice using and improving on these forecasting models to provide farmers with additional climate forecasts related to onset dates of seasonal rains.
Recommendations Develop local specific models to forecast onset of seasonal rains using other indigenous rainfall indicators that are commonly observed by farmers and meteorologists.
Recommendations Replicate the research in other region beyond the equator region.