Download
1 / 57
590 likes | 736 Views
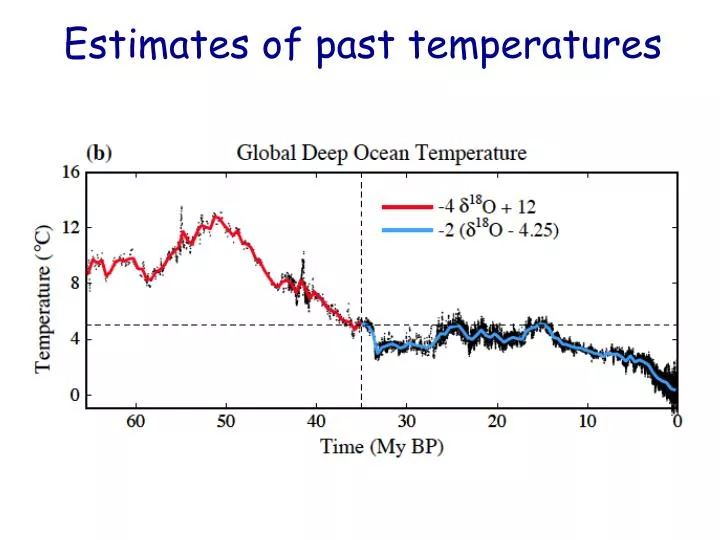
Estimates of past temperatures. Who’s driving?. Total “forcing” based on temperature estimates. Changes in solar radiation and albedo. Changes in greenhouse gases. Pleistocene Glaciations. Causes of the Pleistocene glaciations:. India-Asia collision – decreased greenhouse

E N D
Who’s driving? Total “forcing” based on temperature estimates Changes in solar radiation and albedo Changes in greenhouse gases Pleistocene Glaciations
Causes of the Pleistocene glaciations: India-Asia collision – decreased greenhouse Ice-albedo feedbacks once ice formed on Antarctica
Continental ice in North hemisphere Decreasing temperature
Earth’s major glaciations WARM WARM WARM WARM Last 2.5 million years – Pleistocene glaciations 800-600 million years ago – Snowball Earth 2.5-2.3 billion years ago – Huronian glaciations 4.5 billion years ago – Earth forms 300-270 million years ago – Permo-Carboniferous glaciations
Pleistocene Ice Ages: Goals for the next 2 classes • EXPLAIN how evidence from both land and sea supports the orbital theory of recurring ice ages during the Pleistocene. • COMPARE today’s atmospheric CO2 concentration and rate of change of atmospheric CO2 to times in the past. • INFER what conditions were like during the last ice age, based on geologic data • COMPARE orbital configurations that favor glaciation versus those that favor deglaciation • CONSTRUCT positive feedback loops that amplify Pleistocene climate cycles.
RELEVANCE = ? +
Recent climate change: Carbon dioxide ~385today Atm CO2
Warm Measure of Temperature 385 Cold Last Glacial The past 250,000 yrs: from Antarctica CO2 (ppmv) AGE (ka)
Clicker question: Which one(s) of the following do you think describe conditions during the last ice age? 1. Ice covering most of the continents 2. Ice covering most of Canada 3. Higher albedo 4. Fewer woolly mammoths5. Lower sea level 6. Fewer volcanoes A. 1,5 & 6B. 1,3 & 4C. 1,2 & 5 D. 2,3 & 5 E. 2,3,5 & 6
What were ice ages like? Interglacials Ice Ages Fennoscandian Laurentide ICE COVER
What were ice ages like? Lower sea level. Exposed continental shelves
What were ice ages like? Terrestrial biogeographical shifts
G. dutertrei N. pachyderma What were ice ages like? Marine biogeography Different species in different environmental conditions
Glacial – Modern sea surface temperature Subpolar, MUCH COLDER Increased latitudinal temperature gradient during glacial times Eastern tropical, COLDER Subtropics ~= CLIMAP, 1976
Clicker question: Given the sea surface temperature map created by CLIMAP, how might you expect surface winds to change during an ice age? A. Surface winds would be STRONGER than today B. Surface winds would be WEAKER than today C. Surface winds would be the SAME as today
Northern hemisphereice: Last glacial Ice flow lines Marshak, 22.39
Evidence: Glacial erosion/deposition- Moraines Marshak, 22.28 Marshak, 22.25
Terminal moraines, North America Marshak, 22.42
Evidence: Distillation of water Fractionation of oxygen isotopes 16O (light) & 18O (heavy) • Sea level • Ice sheet size 16O “lighter” H216O H216O H216O H218O 18O “heavier”
Clicker question: What’s the approximate length of the large, prominent climate cycles over the past million years? A. 10,000 years B. 20,000 yearsC. 50,000 years D. 100,000 years E. 200,000 years
1860’s: James Croll Hypothesis: past variations in ice sheets were a result of changes in the earth’s orbit and the amount of solar radiation reaching the Earth’s surface.
Milutin Milankovitch in the 1930s Using principles of celestial mechanics calculated variations in the amount of solar radiation reaching the Earth’s surface over time (especially at ~ 60-65°N in summer!)
Milankovitch cycles: Eccentricity The Earth orbit is slightly elliptical In the course of the year, the Earth-Sun distance varies slightly Highesttotal incoming solar radiation Lowest total incoming solar radiation X
Milankovitch Cycles Eccentricity ~ 100,000 year cycles Circular Elliptical
Started here, 2nd class 1st content slide is a repeat
Remember the on-line survey you completed at the beginning of the semester as part of a major initiative to improve science education. ***To get the 1%extra credit you must complete the on-line survey again by Dec. 4thth, 2009 Visit: http://www.eos.ubc.ca/scripts/courses/saess/survey.html login: saess password: earth This link is also posted on the course website. It will also be emailed to you
PLEASE ENSURE YOUR STUDENT NUMBER IS FILLED IN CORRECTLY!!CHECK ALL THE COURSES THAT YOU ARE TAKING!YOU ONLY HAVE TO FILL OUT THE SURVEY ONCE FOR ALL OF THEM!
Pleistocene Ice Ages: Goals for the next 2 classes • EXPLAIN how evidence from both land and sea supports the orbital theory of recurring ice ages during the Pleistocene. • COMPARE today’s atmospheric CO2 concentration and rate of change of atmospheric CO2 to times in the past. • INFER what conditions were like during the last ice age, based on geologic data • COMPARE orbital configurations that favor glaciation versus those that favor deglaciation • CONSTRUCT positive feedback loops that amplify Pleistocene climate cycles.
Milankovitch Cycles Eccentricity ~ 100,000 year cycles Circular Elliptical
Maximum solar radiation at perihelion when eccentricity is maximum Minimum solar radiation at the aphelion when eccentricity is maximum Milankovitch cycles: Eccentricity Perihelion Aphelion
Milankovitch Cycles: Tilt (Obliquity) 23.5° The Earth’s axis of rotation is tilted relative to the plane of the Earth’s orbit
Milankovitch Cycles Obliquity (tilt) ~ 41,000 year cycles
Clicker question: Which scenario would produce the strongest SEASONAL CONTRAST (warmer summers, cooler winters)? • Earth’s angle of tilt today • Earth’s minimum angle of tilt • Earth’s maximum angle of tilt • Zero tilt
When the tilt is more pronounced: Earth’s tilt toward or away from the Sun increases winters and summers are more intense when the tilt is less pronounced: Earth’s tilt toward or away from the Sun decreases winters and summers are milder ..it changes with a period of 41,000 years
Milankovitch Cycles Precession ~ 19,000 & 23,000 year cycles
Precession of the axis of rotation Today the axis is pointing to the North Star… …but over time, the axis traces out a circle and points toward other stars.
Precession of the axis of rotation In about 11,000 years: Northern summer solstice will be on the opposite side Orientation of axis of rotation determines the position of the summer and winter solstices and equinoxes along the orbit Today: Northern summer solstice
N Milankovitch Cycles Precession of the equinoxes N. Hem.Winter S. Hem.Summer TODAY N. Hem.Summer S. Hem.Winter N. Hem.Summer S. Hem.Winter N. Hem.Winter S. Hem.Summer ~ 11,000 yrs ago
Clicker Question: Given today’s orbital configuration as shown below, which hemisphere has higher seasonal contrast, based on solar radiation received? • Northern hemisphere • Southern hemisphere • The hemispheres have equal seasonal contrast N N TODAY S S
N Milankovitch Cycles Precession of the equinoxes N. Hem.Winter S. Hem.Summer TODAY N. Hem.Summer S. Hem.Winter South: high seasonal contrast North: low seasonal contrast N. Hem.Summer S. Hem.Winter N. Hem.Winter S. Hem.Summer ~ 11,000 yrs ago South: low seasonal contrast North: high seasonal contrast
Clicker Question: What orbital conditions would FAVOR growth of an ice sheet? Consider high/low seasonal contrast and consider WHERE on Earth the ice sheets have grown during the Pleistocene… A. High tilt angle, June 21st at aphelion B. High tilt angle, June 21st at perihelion C. Low tilt angle, June 21st at aphelion D. Low tilt angle, June 21st at perihelion
What conditions favor ice sheet growth? James Croll: 1860s: Thought cold winters (high seasonal contrast) were the key. Changes in precession of the equinoxes would grow ice sheets in one hemisphere while they decayed in the other. Milankovitch: 1920s: Thought cool northern hemisphere summers were the key. “Warm” winters, “cool” summers snow that fell during the winter would be less likely to melt away during the summer. Called on low seasonal contrast at high latitude in the northern hemisphere where most of the ice sheet grow and decay takes place. Low tilt Precession and eccentricity configuration such that N. Hem. has low seasonal contrast
N Kinda like today… Precession of the equinoxes N. Hem.Winter S. Hem.Summer TODAY N. Hem.Summer S. Hem.Winter South: high seasonal contrast North: low seasonal contrast N. Hem.Summer S. Hem.Winter N. Hem.Winter S. Hem.Summer ~ 11,000 yrs ago South: low seasonal contrast North: high seasonal contrast
Orbital configuration for an ice age Glaciations have occurred when solar radiation reaching 65°N in summer is lowest Eccentricity: most pronounced (aphelion is longest) Tilt: least pronounced (milder summers) Precession: Northern summer solstice at aphelion Aphelion Perihelion
Orbital configuration to END an ice age Deglaciations have occurred when solar radiation intensity reaching 65°N in summer is strongest… Eccentricity; most pronounced (perihelion shortest) Tilt: most pronounced (stronger summers) Precession: Northern summer solstice at perihelion Aphelion Perihelion
Deglaciations Glaciations Variations in incoming solar radiation per unit surface area (insolation) at 65°N k.y. Precession, obliquity & eccentricity change with different periods sometimes they reinforce or they weaken each other
Less ice Low 18O/16O High 18O/16O More ice