Download
1 / 10
100 likes | 248 Views
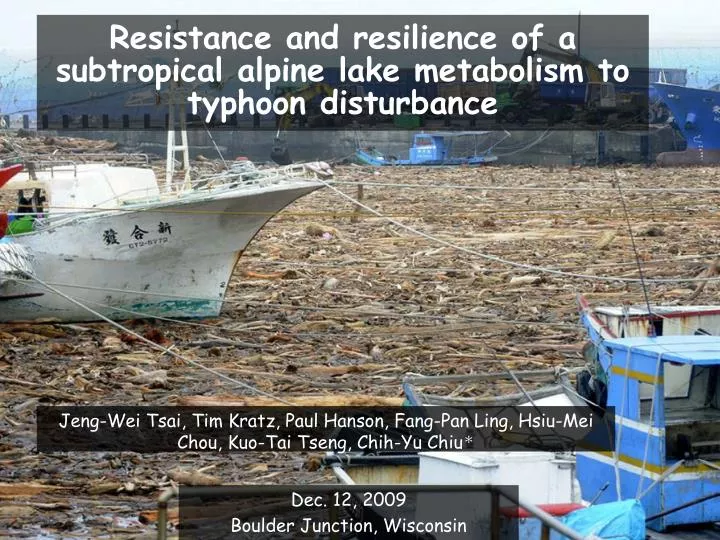
Resistance and resilience of a subtropical alpine lake metabolism to typhoon disturbance. Jeng-Wei Tsai, Tim Kratz, Paul Hanson, Fang-Pan Ling, Hsiu-Mei Chou, Kuo-Tai Tseng, Chih-Yu Chiu *. Dec. 12, 2009 Boulder Junction, Wisconsin. Location map of Yuang-Yang Lake (YYL). YYL. Taiwan.

E N D
Resistance and resilience of a subtropical alpine lake metabolism to typhoon disturbance Jeng-Wei Tsai, Tim Kratz, Paul Hanson, Fang-Pan Ling, Hsiu-Mei Chou, Kuo-Tai Tseng, Chih-Yu Chiu* Dec. 12, 2009 Boulder Junction, Wisconsin
Location map of Yuang-Yang Lake (YYL) YYL Taiwan Water level sensor 4.5m Buoy outlet YYL was hit by 1-6 typhoons per year. A typhoon might drop more than 2000mm rain in this 4.5m-depth lake.
typhoon input washout GPP ER DOC nutrient nutrient How Typhoon Change Lake Metabolism?
Time series of meteorological and metabolic parameters T8 T9 T4 Wind speed T14 T11 Precipitation T2 T3 T10 Precipitation (mm d-1) T13 Wind speed (cm s-1) T6 T15 T7 T5 T1 T12 GPP Metabolism (μmole O2 m-3 d-1) ER 2004 2005
Temporal response of LM to typhoons GPP 476% 359% 67% NS NS -2.8% -8% -26% -16% -47% -44% -64% -34% -29% -81% -74% -46% ER 629% 770% 254% 331% 91% 59% 67% 26% 24% NS 12% 4% Response of metabolism -4% NS NS -23% -32% -84% NEP -46% -30% -14% -21% -11% NS NS -89% 30% 40% 27% 70% 148% 99% 339% 335% 359% T11 T13 T14 T15 T10 T12 T1 T5 T6 T7 T8 T9 T4 T2 T3
Time Series of DO and Metabolic Parameters DO drops, R and Fatm increase after typhoons T1 (160mm) DO at surface GPP ER Fatm LN (lake number) Metabolism, atmospheric flux (mμmole O2 m-3 d-1), lake number (-) DO (mg L-1) 16-Aug 18-Aug 8-Aug 14-Aug 10-Aug 6-Aug 12-Aug T8 (650mm) 7-Jul 9-Jul 13-Jul 15-Jul 17-Jul 19-Jul 11-Jul
Resistance & resilience Index of resistance: C0 3 days Response variable D0 DX RS=1 D0=0 no effect (maximal resistance) RS=0 D0=C0 100% increase or decrease RS<0 D0>C0 >100% increase or decrease Cx Index of Resilience: time RL=1 Dx=0 full recovery (maximal resilience) RL=0 Dx=D0 no recover at all RL<0 DX>D0 continuously increase or decrease (Orwin and Wardle, 2004)
Resistance of LM R2=0.16 P<0.05 R2=0.13 P<0.05 R2=0.42 P<0.05 resistance (RS) GPP ER NEP GPP R2=0.40 P<0.05 R2=0.22 P<0.05 R2=0.02 P<0.05 resilience (RL) ER NEP GPP Accumulated precipitation (mm)
Summary • Most of the typhoon events loweredGPP(2.8%-81% decrease), increase ecosystem respiration (4%-770% increase), and thus the lake because more heterotrophic after typhoons (27%-359% increase in heterotrophy). • The resistance and resistance of the lake metabolism (LM) depended on the amount of precipitation (AP). Smaller typhoons (with AP< 200 mm) caused stronger effects on LM, howevery, LM recovered faster than they did in medium- and large-sized typhoons (AP 200–600 mm). • The response of the LM is likely linked to typhoon-induced changes in DOC quantity and quality and the biomass of primary producers.
Mb Assess the typhoon disturbance -metabolic changes GPP ER NEP Ma response = Ma- Mb time The difference between 3-day means before and after typhoons represents the metabolic response