Download
1 / 5
50 likes | 168 Views
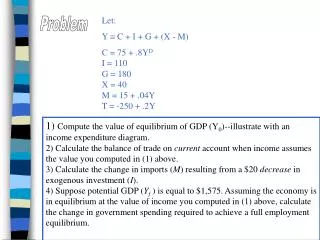
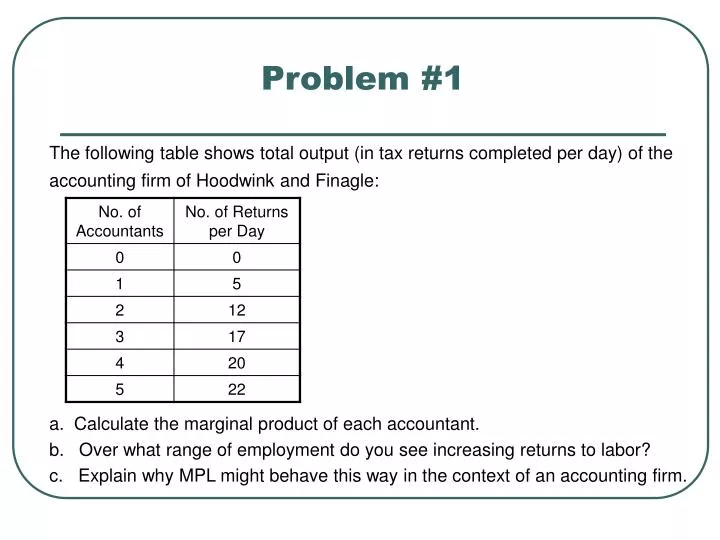
Problem #1. The following table shows total output (in tax returns completed per day) of the accounting firm of Hoodwink and Finagle: a. Calculate the marginal product of each accountant. b. Over what range of employment do you see increasing returns to labor?

E N D
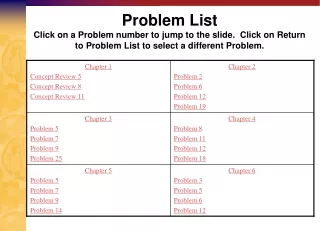
Problem #1 The following table shows total output (in tax returns completed per day) of the accounting firm of Hoodwink and Finagle: a. Calculate the marginal product of each accountant. b. Over what range of employment do you see increasing returns to labor? c. Explain why MPL might behave this way in the context of an accounting firm.
Problem #2 of Chapter 7 Until recently, your early salary was $35,000. To open you own business you quit your job, cash in a $10,000 savings account (which pays 5% interest), and use the money to buy a business. You also convert a basement apartment in your house, which you have been renting for $250 a month, into a workspace. You lease some office equipment for $3,600 a year and hire two part-time programmers, whose combines salary is $25,000 a year. Utilities cost around $50 a month. a. Annual explicit cost? b. Annual implicit cost? c. At the end of 1st year your total sales were $55,000 and your accountant congratulates you. Good or bad?
Problem #3 SR and LR total cost curves are given. a. Which column give SR TC and LR TC? c. At what output level firms SR and LR input mixes will be the same? d. Starting from producing two units, management decided to double production to four units. So they simply doubled all of their inputs in the long run. Comment. e. Over what range of output do you see economies of scale, diseconomies of scale, and constant returns to scale?
Problem #5 Ludmilla’s house of Schnitzel is currently producing 10 schnitzels a day at point A. Her business partner, Hans, wants her to double production immediately. a. What point will likely illustrate Ludmilla’s cost situation for the near future? Why? b. If Ludmilla wants to keep producing 20 schnitzels, at what point does she want to be eventually? How can she get there? c. Eventually, Ludmilla and company do very well, 70 schnitzels a day. But after a few years, Ludmilla discovers that profit was greater when she produced 20 schnitzels per day. She wants to scale back production to 20 schnitzels per day, laying off workers, selling off equipment, renting less space, and producing fewer schnitzels. Hans wants to reduce output by just cutting back on flour and milk and laying off workers. Who’s right? d. Does the figure tell us what output Ludmilla should aim for?
Problem #6 a. Over what range of output firm experiences increasing marginal returns to labor? Decreasing MPL? b. As output increases, do AFC behave as described in the text? c. As output increases, do MC, AVC, and ATC behave as described in the text? d. Looking at the numbers, without graph, is the relationship between MC and AVC as described in the text? What about the relationship between MC and ATC?