Download
1 / 25
250 likes | 397 Views
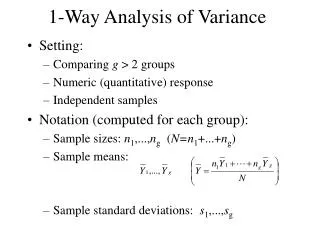
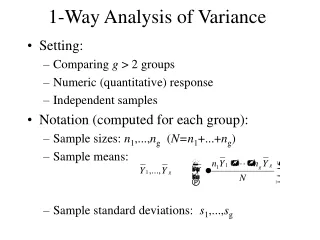
Two-Way Analysis of Variance . 2-Factor ANOVA. Previously… . We learned how to conduct a one-way ANOVA, one-way meaning that we had only one independent variable. If we have two independent variables, we could conduct two separate one-way ANOVAs, but there is a better way. 2-Factor ANOVA.

E N D
Two-Way Analysis of Variance 2-Factor ANOVA
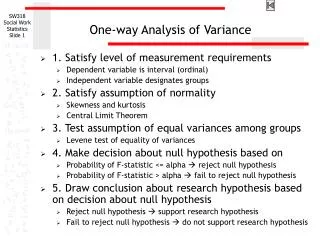
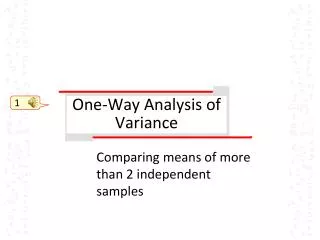
Previously… • We learned how to conduct a one-way ANOVA, one-way meaning that we had only one independent variable. • If we have two independent variables, we could conduct two separate one-way ANOVAs, but there is a better way.
2-Factor ANOVA • The two-way ANOVA not only gives you information about the effect of each variable but also the effect of both variables combined (their interaction). • Just as in a one-way ANOVA, you can have any number of levels (2+) for each of the independent variables.
Factors • As mentioned before, a factor is an IV. • If you have two levels of one IV and three levels of the other IV, you have a 2 × 3 factorial design. • For example: A = Drug, B = Placebo, and 1-3 are types of talk therapy.
Factors • With a 2 × 3 factorial design you need 6 groups (2 × 3 = 6). • Even though you need a lot of groups, a two-way ANOVA is more economical than two one-way ANOVAs because you can test the effects of both IVs with the same number of subjects.
Experimental Design • For a 2 × 2 factorial design: Pop. Cx Tx IV 1 Cx+D Cx +P Tx +D Tx +P IV 2
Interaction • As mentioned before, we get additional information about the effects of both IVs on your DV (see pg. 283).
Main Effect vs. Interaction • If you averaged the points obtained from all levels of each IV and compared each mean, that would be your main effect. • If you notice the plotted lines converging, diverging, or crossing, that is interaction. If the lines are parallel, you have no interaction.
Advantages of the 2-Way ANOVA • Additional information: Interaction between the two variables • Economical: Information about an additional variable plus interaction with the same number of subjects • Increased power • Greater generalizability: your results may apply to more populations
Outcome • Instead of a single F, you will get three Fs, one for each IV and one for interaction. • The computation is more involved, and we won’t do it by hand. • But you should be able to interpret the results of a 2-way ANOVA if given an ANOVA summary table.
Finding Fcrit • Just as before, you will need to use df values. They may be different for each of the Fcrit values. Just remember the numerator/denominator rule and you’ll be set. • Looking at the F table, for the column use the dfthat was used in the numerator of F, and for the row, use the df that was used in the denominator (the denominator df should be the same for all F values).
Graphs • We can get a pretty good idea of what’s going on by looking at graphs. • In this case, we can see that Factor B probably has a significant main effect, but Factor A has no effect.
Graphs • How about this one? Factor A Factor B Interact. None
Graphs • How about this one? Factor A Factor B Interact. None
Graphs • How about this one? Factor A Factor B Interact. None
Graphs • How about this one? Factor A Factor B Interact. None
Graphs • How about this one? Factor A Factor B Interact. None
Graphs • How about this one? Factor A Factor B Interact. None
Null Hypothesis • Because we have three Fs, we have three null hypotheses: • H0: μA1 = μA2 = μAa • H0: μB1 = μB2 = μBb • The simple effect of Factor A are the same at all levels of B.
Null Hypothesis Review • One-sample t Test • H0: μ1 = μ0 • Two-sample t Test • H0: μ1 = μ2 • One-way ANOVA • H0: μ1 = μ2 = μK
Interpretation Review • Any time you are doing a test of “significance” and you find a significant result, the correct interpretation is as follows: • The probability of getting a difference this large or larger if the the null hypothesis is true is [p-value] (e.g., less than .01).
For the Quiz: • Make sure you can decide which test to use based on the information provided. • For example, if you want to compare the effects of 4 different types of drugs on a memorization task, which test would you use?
The Tests You Should Now Know • One-sample t Test (or CI for μ) • Two-sample t Test – Independent Samples • Two-sample t Test – Dependent Samples • One-way Analysis of Variance • Two-way Analysis of Variance
Homework • Study for Chapter 12 Quiz • Read Chapter 13 • Do Chapter 12 HW