Download
1 / 72
930 likes | 1.77k Views
Agricultural Production Management. Production Management Categories. Classified into four types of Production Management Soil and Crop management Pest management Nutrient management Water management. Types of Farming Systems.

E N D
Production Management Categories • Classified into four types of Production Management • Soil and Crop management • Pest management • Nutrient management • Water management
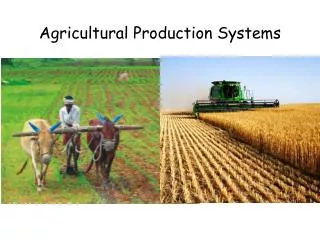
Types of Farming Systems • Combination of production management practices employed to achieve production, profit, and increasingly, environmental and sustainability objectives • Conventional, high-synthetic-input systems • Reduced –synthetic-input systems • Cultural practices • Biological practices • Organic farming systems
Types of Farming Systems • Other ways of Grouping Systems • Cropping systems • Tillage systems • Irrigation systems
Factors Affecting Farmer’s Decisions • Management skills • Economic factors • Environmental pressures • Availability of technology and technical support
Importance of Soil • As the key resource in crop production • It supports the physical, chemical, and biological processes • Regulates water flow such as • Infiltration • Root-zone storage • Deep percolation • Run-off
Importance of Soil • Acts as a buffer between inputs and environment • Functions as “degrader” or “immobilizer” of agricultural chemicals, wastes, or other pollutants • Soil also sequesters carbon from the atmosphere
Important Soil attributes • Texture • Structure • Bulk density and rooting depth • Permeability and water storage capacity • Carbon content • Organic matter and biological activity • pH • Electrical conductivity
Three functions of soil(from NRC) • Provides the physical, chemical, and biological processes for the growth of plants • To store, regulate, and partition water flow through the environment • To buffer environmental change by decomposing organic wastes, nitrates, pesticides, and other substances that could become pollutants
Soil Quality • Defined: The capacity of soil to function or the fitness for use • Can be maintained through use of appropriate crop production technologies and resource management systems • Two concepts of measuring soil quality • More traditional: focuses on inherent soil properties • More recent: focuses on dynamic properties of soil
Land capability and suitability • Two types of measurements: • Land Capability Classes (LCC’s) • Prime farmland designation • Used to measure land capabilities for a particular purpose: • Growing crops and trees • Grazing animals • Nonagricultural uses
Land Capability Classes (LCC’s) • Range from I to VIII: • Class I: no significant limitations for raising crops; About 7% of US cropland • Classes II and III: have some limitations such as poor drainage, limited root zones, climatic restrictions, or erosion potential; make up over ¾ of US cropland
Land Capability Classes (LCC’s) • Class IV: suitable only under selected cropping practices • Classes V, VI, and VII: best suited for pasture and range • Class VIII: is only suited for wildlife habitat, recreation, and other non-agricultural uses • LCC’s I through III total 337 million acres, or 82% of US cropland excluding Alaska
Prime Farmland • Based on physical and morphological soil characteristics: • Depth of water table to the root zone • Moisture-holding capacity • Degree of salinity • Permeability • Frequency of flooding • Soil temperature • Erodibility • Soil acidity
Prime Farmland • Factors needed to sustain high yields when treated and managed • Growing season • Moisture supply • Soil quality • Totals 222 million acres, or 54% of US cropland excluding Alaska
Productivity • Measures output per unit input • Often measured as crop yield per acre • Can reflect soil degradation if yields decline as soils become degraded and more inputs are used to compensate for decline in soil quality
Erodibility • Highly erodible lands (HEL) is a soil quality measure that is important to USDA conservation policy • USDA uses the erodibility index (EI) to classify erosion potential
Erosion Productivity Loss • Measure of productivity loss that converts total erosion from tons per acre per year to inches per year • 3 factors reflected in this measure: • Erosion rates • Soil depth • Rental values of land
Five major concentrations of vulnerable soils • Largest: Iowa, Illinois, and Missouri in the corn belt • Second: eastern North Dakota and western and south central Minnesota • Third: eastern bluffs of Mississippi River in western Kentucky, Tennessee, and along eastern edge of Mississippi Delta • Fourth: eastern edge of Colorado • Fifth: band of land in eastern Washington and Oregon around Palouse and Central Plateau
Effects of erosion • Two types: • Onsite effects • Offsite effects • Major onsite effect is impact on soil productivity • Offsite damages occur when: • Sediment enter the streams, rivers, lakes, and other water bodies and damages municipal water systems • Fills reservoirs and streams interfering with navigation, and contributes to flooding
Inappropriate farming practices • Lead to: • Soil degradation • Soil erosion • Loss of organic matter • Soil compaction • Acidification • Loss of nitrates, phosphates, and pesticides • Accumulation of salts and trace elements • Increased run-off of fertilizers and pesticides to water systems
Soil Degradation • 3 Processes • Physical • Wind erosion • Water erosion • Compaction • Chemical • Toxification • Salinization • Acidification • Biological • Declines in organic matter • Declines in carbon • Declines in the activity and diversity of soil fauna
Rotational Cropping • Can play significant role in conserving soil, maintaining soil fertility, controlling pests, and also helps break up insect and disease cycles
Cover Crops • Cover crop of small grains, meadow, or hay planted in the fall after harvest of a row crop provides vegetative cover to reduce soil loss, hold nutrients, add organic matter to the soil, and sequester carbon
Crop Residue Management (CRM) • CRM leaves crop residues on soil surface through less intensive tillage practices. • Usually cost effective • Protects soil surface • Leads to higher farm economic returns
Conservation buffers and Structures • Structures and buffers reduce water erosion caused by rainfall • Very important component of farm soil management systems
About pesticide • One of the first growing agricultural production inputs since the post WW2 • $8.8 billions spent in the U.S. in 1997 • Herbicides, Insecticides, Fungicides, and Other pesticides • Herbicides and insecticides account for most
Herbicides • Largest pesticide class (62% of total quality of pesticide active ingredients) • Weeds compete with crops for water, nutrients, and sunlight, and cause reduced yields. • Atrazine,2,4-D, dicamba, and trifluralin are widely used for more than 30 years
Insecticides • Account for 10 percent of the total quantity of pesticides applied in 1997 • Damaging insect populations can vary annually depending on weather, pest cycles, cultural practices such as rotation and destruction of host crop residues • Preventive treatments and intervention treatments
Insecticides, cont. • Corn and cotton account for the largest shares of insecticide use • Chlorpyrifos and methyl parathion are the two most widely used insecticides
Fungicides • Applied to fewer acres than are herbicides and insecticides and account for the smallest shares of total pesticide use • Mostly used on fruits and vegetables to control diseases
Other pesticides • Including soil fumigants, growth regulators, desiccants, and harvest aids • Use of these pesticides increases about 8 percent each year since 1990 • About one-fifth of the total pounds of all active ingredients applied to the surveyed crops
Pesticide Treatment Trends • Corn • Corn is the largest crop in the U.S. in terms of acreage • About 30% of the corn acreage in the 10 States received insecticides in 1997 • Corn rootworm was the most frequently treated insect
Trends, cont. • Soybeans • Herbicides account for virtually all the pesticides used on soybeans • The number of acres treated and number of treatments per acre have increased, partly due to the growth in no-till soybean systems • 48% treated both before and after planting
Trends, cont. • Wheat • Wheat , which is one of the largest field crops in the U.S. is the least pesticide-intensive • Account for 27% of the surveyed crop acreage in 1997, though only 4% of total pesticides • Herbicide used 47%of the winter wheat and 82% of the spring and durum sheats
Trends, cont • Cotton • One of the most pesticide-intensive field crops in the U.S. • 96% of cotton acreage received herbicides • 74% received insecticides and 68% received other types of pesticides • Much greater insect infestation on cotton is due to its longer growing season
Trends, cont. • Potatoes • Most pesticide-intensive crops for all types of pesticides • Other Vegetable and Fruits • found it profitable to use insecticides and fungicides on a higher percentage of acreage than growers of most field crops do
Pesticide Expenditures • Annual pesticide expenditures for all farm uses increased from $6.3billion to $8.8 billion over 1991-97 (40% increase) • Pesticide costs per acre increased for • Corn 20% • Cotton 19% • Soybeans 25% • Wheat 10%
Pesticide Resistance • Most likely to develop when a pesticide with a single mode of action is used over and over in the absence of any other management measures to control a specific pest • Herbicide-resistant weeds • Scouting to determine economic thresholds for treatments, alternating the use of pesticide families, and several other management strategies to combat resistance are in use
Biological Pest Management Practices • Include the use of pheromones, plant regulators, and microbial organisms • Biorational pesticides- microbial pesticides and pheromones • biologicals are unlikely to replace pesticides in the foreseeable future, due to the small market • Beneficial organisms
Cultural Pest Management Practice • Number of production techniques and practices, including crop rotation, tillage, trap crops, and irrigation scheduling, and such and such • Controls work by preventing pest colonization of the crop, reducing pest populations, reducing crop injury, and increasing the number of natural enemies in the cropping system
Cultural Pest Management Practice, cont. • Crop rotation • One of the most important cultural techniques • 82% of the U.S. corn acreage • 89% of soybeans • Cultivation for weed control • Field sanitation and water management
Decision Criteria and Information • Scouting and Economic thresholds • To monitor the populations of major insect and other arthropod pests for several decades • Scouting on 70-90% of grape, orange, apple acreage, and thresholds used on a significant proportion of that acreage
Decision Criteria and Information, cont. • Sources of pest management information • Farm supply/chemical dealers • consultants’/pest control advisors • Professional scouting services • Extension advisors
Decision Criteria and Information, cont. • Expert system • Integrate information on pest density, economic thresholds, application methods, and other elements of pest management into a computer software package • Precision Farming • Emerging technology that may allow a more efficient application of inputs by using yield monitors, satellite images, etc.
Factors Affecting Pest Management Decisions • Factors should be influenced by pest infestations, yield and quality losses caused by those infestations, as well as by crop prices and the costs of pesticides and alternative control methods • Changes in planted acres • Weather and other environmental conditions
Factors Affecting Pest Management Decisions, cont. • Pesticide prices • Increased 17% over 1991-96 • Herbicides 17% increase • Fungicide almost 14% increase • Insecticide about 24% increase
Pesticide Regulatory Issues • EPA regulates pesticides under the Federal Insecticide Fungicide and Rodenticide Act (FIFRA) • Pesticide residues in food under the Federal Food, Drug, and Cosmetic Act (FFDCA) • The Clean Air Act, Clean Water Act also contain provisions that affect pesticide manufacturers