Download
1 / 46
460 likes | 627 Views
Ontology-Informed Knowledge Representation in the Immunology Database and Analysis Portal (ImmPort). Megan Kong 1 , Carl Dahlke 2 , Diane Xiang 1 , David Karp 4 , Richard H. Scheuermann 1,3

E N D
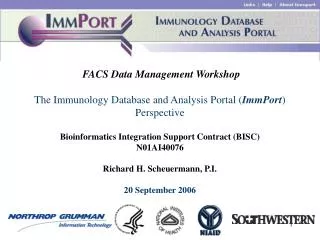
Ontology-Informed Knowledge Representation in the Immunology Database and Analysis Portal (ImmPort) Megan Kong1, Carl Dahlke2, Diane Xiang1, David Karp4, Richard H. Scheuermann1,3 1Department of Pathology, 3Division of Biomedical Informatics, 4Division of Rheumatology, U.T. Southwestern Medical Center, Dallas, TX, 2 Health Information Systems, Northrop Grumman, Inc., Rockville, MD
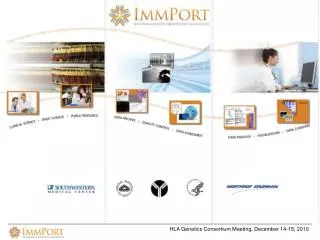
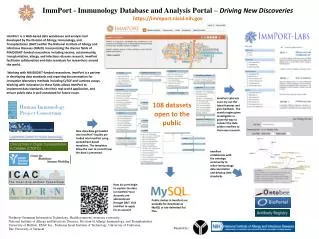
ImmPort Purpose and History • NIH/NIAID/DAIT would like to: • maximize the return on the public investment in basic, translational and clinical research • allow investigators to more effectively extract meaningful information from the vast amounts of data generated from advanced research technologies • => data sharing policy • Bioinformatics Integration Support Contract (BISC) to support data sharing for all DAIT-funded programs - basic, translational and clinical research • Immunology Database and Analysis Portal (ImmPort) - www.ImmPort.org • Archive and manage basic and clinical research data • Integrate these research data with extensive biological knowledge • Support analysis of these integrated data
Support for many large projects that use a variety of different experiment methodologies, including FCM
Browse Data/ ImmPort Research Data/ ImmPort Supported Programs ImmPort Research Data | My Work Bench Immune Function and Biodefense in Children, Elderly, and Immunocompromised Populations Program Population Genetics Analysis Program: Immunity to Vaccines/Infections Program HLA Region Genetics in Immune-Mediated Diseases Program Immune Modeling Centers Other Consortium Projects
Browse Data/ ImmPort Research Data/ ImmPort Supported Programs ImmPort Research Data | My Work Bench Immune Function and Biodefense in Children, Elderly, and Immunocompromised Populations Program Grants/Contracts/Projects:
Semi-public web-based database and analysis portal Multi-level access control Data sharing Data Reference data Types - Gene structure, protein function, polymorphisms, metabolic, regulatory, signaling and other networks, protein-protein, gene-gene, host-pathogen interactions Sources - NCBI, Uniprot, Swissprot, BIND, Reactome Experiment data Methodologies – microarrays, SNP genotyping, flow cytometry, ELISA, ELISPOT, qPCR, imaging, etc. Metadata (defining how the experiment was performed) - common features of all experiments Primary results - from all experiment measurement techniques Processed results Interpreted results Analytical metadata Clinical research data Study design – from clinical protocol Participant characteristics/phenotype – from assessments captured in CRF’s and laboratory testing Query tools To support retrieval of reference and experiment data based on specified criteria Pre-defined QBE Customized semantic queries Ontology Thesaurus function Organize terms and define relationships Analysis tools Genetic analysis LD analysis TagSNP selection Haplotype reconstruction Genotype-phenotype association Gene expression analysis Filtering/normalization Clustering Classification Cell population analysis Standard FACS statistics Novel population identification based on high dimensional data clustering Measurement of immune response (e.g., ELISA, ELISPOT) Statistical analysis of distributions Biological network analysis Quantification of topological parameters Module identification Visualizationtools Genome display, including genes, introns, exons, SNPs, tagSNPs, etc. Genetic analysis results Gene expression results Networks, pathways, and molecular interactions Graphing and charting of statistical results ImmPort Overview - System Components
Varicella: • Immune Response to Varicella Vaccination in Subjects with Atopic Dermatitis Compared to Nonatopic Controls • Objectives: • To determine if children with AD have Varicella-specific cell mediated immune (CMI) responses to varicella vaccination that differ from those of nonatopic controls (Th2) • Endpoint: • ELISPOT: number of Varicella-specific T-cell • ELISA: levels of Varicella-specific antibodies • Flow cytometry: perforin generation using 2-color flow cytometry staining for both CD8 and perforin. • (Perforin levels, which may contribute to defects in CD8+ cytotoxic T lymphocyte function).
Why OBX? • Challenges • Extensive phenotypic characteristics of interest • Complex study designs of treatments, assessments, samplings, etc. • Few standards for how they are described or captured • Each supported project captures their data in a different format • Integration with mechanistic studies of specimens
Why OBX? • Challenges • Extensive phenotypic characteristics of interest • Complex study designs of treatments, assessments, samplings, etc. • Few standards for how they are described or captured • Each supported project captures their data in a different format • Integration with mechanistic studies of specimens • Evaluation of existing clinical data standards • BRIDG – designed for supporting the conduct of clinical trials, not a study repository optimized for analysis • CDISC STDM – specification for SAS transport files to the FDA • CDISC CDASH – models clinical encounters, but not sequence of events; requires use of EPOCHs (contiguous blocks of time) • None designed to manage mechanistic studies
Why OBX? • Challenges • Extensive phenotypic characteristics of interest • Complex study designs of treatments, assessments, samplings, etc. • Few standards for how they are described or captured • Each supported project captures their data in a different format • Integration with mechanistic studies of specimens • Evaluation of existing clinical data standards • BRIDG – designed for supporting the conduct of clinical trials, not a study repository optimized for analysis • CDISC STDM – specification for SAS transport files to the FDA • CDISC CDASH – models clinical encounters, but not sequence of events; requires use of EPOCHs (contiguous blocks of time) • None designed to manage mechanistic studies • Ontology-Based eXtensible Data Model (OBX) • Logical ontology structure (BFO/OBI) => extensible data model • Data element value sets derived from ontology hierarchy
Entities of Interest • Objects • Human subjects • Specimens • Materials • Plans • Qualities – clinical phenotype • Malar rash • WBC count • Weight • Blood glucose levels • Atopic dermatitis • Roles • Principal investigator, study coordinator, study participant • Reagent, therapeutic • Processes • Recruitment, enrollment, approval • Assays, physical exams • Blood draw, PBMC isolation • Treatment, surgery (interventions) • Context • Time • Environment
Lab test mapping into OBX Blood Test:
FLOCK v2.0 STEPS 1. File Conversion - Convert binary .fcs file into a data matrix 2. Data Cleansing - Remove boundary events (noise) in FSC and SSC dimensions 3. Data Shrinking - Collapse data toward distribution modes 4. Normalization - Z-score normalization for values in each dimension ((xi - µ)/SD) 5. Dimension Selection - Select most informative dimensions based on measures of dispersion and distortion 6. FLOCK LoD i. Partition each dimension to generate a hyper-grid ii. Identify dense hyper-regions in hyper-grid iii. Merge neighboring dense hyper-regions to define hyper-region groups (n) iv. Determine centroids for each hyper-region group v. Use n centroids to seed single round of distance-based clustering 7. FLOCK HiD - Refine population definition based on histogram partitioning 8. Group Merging - Merge close hyper-region groups based on [distance metric] 9. Centroid Calculation - Compute centroid for each hyper-region group 10. Clustering - Cluster events to nearest centroid 11. Population statistics - Summarize population proportions, intensity levels, etc. 12. Visualization
17 B Cell Populations in Blood A PB GSM GNSM UM3-4 UM1-2 CD38 CD27 B220 N1-3 DNM IgD CD24 IgG
B cell component of the Cell Ontology http://www.obofoundry.org/
Summary • OBX is an ontology-informed clinical research data model • Ontological framework incorporated provides for extensibility and straightforward incorporation of ontology terms as value sets • Ontological framework also facilitated distributed data model development and guides ongoing mapping strategies • Successfully loaded several large, distinct clinical studies • Developed user interfaces for data extraction and analysis • Refinement through use – mapping, loading, extracting, analysis • Term submission to OBO Foundry ontologies, especially OBI
Acknowledgments UT Southwestern Yu (Max) Qian Jamie Lee Megan Kong Jennifer Cai Jie Huang Nishanth Marthandan Diane Xiang Young Bun Kim Paula Guidry Eva Sadat David Karp Northrop Grumman Carl Dahlke John Campbell Liz Thompson Jeff Wiser Mike Attasi OBO Foundry BFO OBI Supported by NIH N01AI40076