Download
1 / 34
340 likes | 427 Views
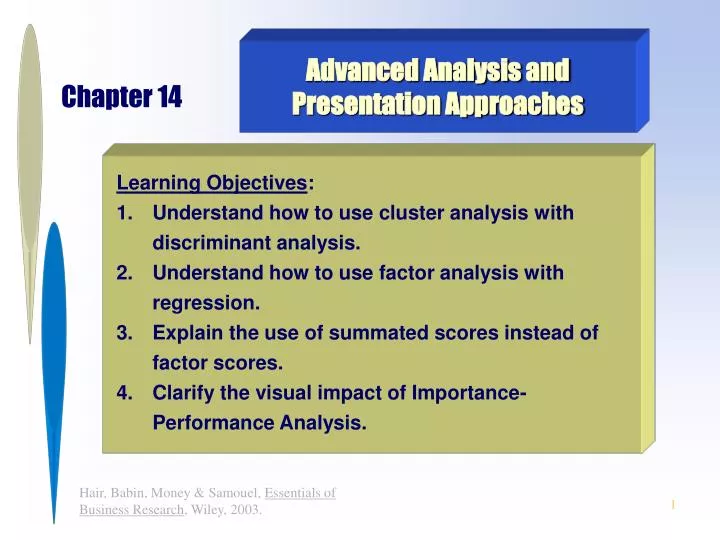
Chapter 14. Advanced Analysis and Presentation Approaches. Learning Objectives : Understand how to use cluster analysis with discriminant analysis. Understand how to use factor analysis with regression. Explain the use of summated scores instead of factor scores.

E N D
Chapter 14 Advanced Analysis and Presentation Approaches Learning Objectives: • Understand how to use cluster analysis with discriminant analysis. • Understand how to use factor analysis with regression. • Explain the use of summated scores instead of factor scores. • Clarify the visual impact of Importance-Performance Analysis.
Relationship Variables from Customer Survey 17. How satisfied are you with Samouel’s restaurant? Not Satisfied Very At All Satisfied 1 2 3 4 5 6 7 18. How likely are you to return to Samouel’s restaurant in the future? Definitely Will Definitely Will Not Return Return 1 2 3 4 5 6 7 19. How likely are you to recommend Samouel’s restaurant to a friend? Definitely Will Not Definitely Will Recommend Recommend 1 2 3 4 5 6 7 20. How often do you patronize Samouel’s restaurant? 1 = Occasionally (Less than once a month) 2 = Frequently (1 – 3 times a month) 3 = Very Frequently (4 or more times a month) 21. How long have you been a customer of Samouel’s restaurant? 1 = Less than One Year 2 = One year to three years 3 = More than three years
Cluster Analysis Research Questions Research Question One: “Can clusters be identified?” Research Question Two: “Are the clusters valid?” Research Question Three: “Do the perceptions variables predict the clusters?”
Exhibit 14-2 Error Coefficients and Error Reduction for Satisfaction Variables’ Cluster Solutions Error CoefficientsError Reduction Four Clusters = 140.865 3 – 4 Clusters = 42.013 Three Clusters = 182.878 2 – 3 Clusters = 99.972 Two Clusters = 282.850 1 – 2 Clusters = 551.405 One Cluster = 834.255
Exhibit 14-5 ANOVA Results for Two-Cluster Solution of Satisfaction Variables ANOVA
Exhibit 14-6 Validation Statistics for Two-Group Satisfaction Clusters Descriptives ANOVA
Exhibit 14-7 Prediction of Customer Satisfaction Clusters Wilks’ Lambda Classification Results* *79.0% of original grouped cases correctly classified.
Exhibit 14-9 Group Means for Food and Employee Independent Variables Group Statistics
Exhibit 14-10 Rotated Factor Solution for 12 Perceptions Variables on the Customer Survey
Exhibit 14-10 Rotated Factor Solution for 12 Perceptions Variables on the Customer Survey Continued
Factor Scores . . . are composite scores calculated for each respondent on each of the derived factors.
Exhibit 14-11 Factor Scores for Five Respondents in Customer Survey Factors 1 2 3 4 Respondents #1 -.89212 1.24493 .84853 -.38169 #2 -2.33246 -1.01861 .21274 .65610 #3 -.55517 -1.14659 -.90178 -.91886 #4 -.22994 -1.91237 .23862 -.20539 #5 -.03014 .19599 1.30175 -.53036
Exhibit 14-12 Descriptive Statistics for Multiple Regression Using Factor Scores
Exhibit 14-13 Multiple Regression Using Factor Scores Model Summary *Predictors: (Constant), Food Factor, Employees Factor, Atmosphere Factor, Value Factor
Exhibit 14-13 Multiple Regression Using Factor Scores Continued ANOVA *Predictors: (Constant), Dependent Variable: X17 – Satisfaction
Exhibit 14-14 Regression Coefficients for Regression Models Coefficients* *Dependent Variable: X17 – Satisfaction
Exhibit 14-15 Raw Data for 12 Perceptions Variables on Customer Survey Perceptions Variables ID X1 X2 X3 X4 X5 X6 X7 X8 X9 X10 X11 X12 1 6 4 1 6 4 4 4 3 6 3 3 2 2 6 5 3 4 4 4 5 4 4 4 4 3 3 7 4 4 7 6 4 4 3 7 4 3 4 4 3 4 5 3 3 2 5 4 3 5 2 1 5 5 4 5 5 5 5 3 3 5 4 3 2
Summated Scores . . . . are calculated by adding the original scale responses together and determining the mean value.
Exhibit 14-16 Summated Scores for Five Customer Survey Respondents New Summated Scores Variables food_s employ_s atmos_s value_s Respondent ID #1 6.00 3.00 3.67 2.67 #2 5.33 3.67 4.67 3.67 #3 7.00 3.67 3.67 4.67 #4 3.00 1.67 4.33 4.33 #5 5.00 3.33 3.33 4.67
Exhibit 14-17 Discriminant Analysis with Summated Scores Classification Results *79% of original grouped cases correctly classified
Exhibit 14-18 Significant Predictors in Discriminant Function Correlations between discriminating variables and the discriminant function. Variables ordered by absolute size of correlation within function.
Exhibit 14-20 Rankings of Restaurant Selection Factors for Samouel’s Customers Multiple modes exist. The smallest value is shown.
Exhibit 14-20 Rankings of Restaurant Selection Factors for Gino’s Customers Multiple modes exist. The smallest value is shown.
Exhibit 14-21 Means of Selected Perceptions Variables on Customer Survey for Samouel’s
Exhibit 14-21 Means of Selected Perceptions Variables on Customer Survey for Gino’s
Perceptual Mapping . . . . a process used to develop maps that show the perceptions of a company, product, service, brand, or any other object in two dimensions.
Exhibit 14-22 Illustration of Importance/Performance Chart Using Restaurant Customer Survey Database Importance 4 Food Quality 3 Atmosphere Performance 1 2 3 4 5 6 2 Employees Gino’s = Samouel’s = 1 Prices
Advanced Analysis and Presentation Approaches Go On-Line www.yankelovich.com How can business researchers use the data from the research reported on this website?