Download
1 / 32
320 likes | 419 Views
Lecture 5: Major Genes, Polygenes, and QTLs. Major genes --- genes that have a significant effect on the phenotype. Polygenes --- a general term of the genes of small effect that influence a trait. QTL, quantitative trait locus --- a particular gene underlying the trait.

E N D
Major genes --- genes that have a significant effect on the phenotype Polygenes --- a general term of the genes of small effect that influence a trait QTL, quantitative trait locus --- a particular gene underlying the trait. Usually used when a gene underlying a trait is mapped to a particular chromosomal region Candidate gene --- a particular known gene that is of interest as being a potential candidate for contributing to the variation in a trait Mendelizing allele. The allele has a sufficiently large effect that its impact is obvious when looking at phenotype
Major Genes • Major morphological mutations of classical genetics that arose by spontaneous or induced mutation • Genes of large effect have been found selected lines • pygmy, obese,dwarf and hg alleles in mice • booroola F in sheep • halothane sensitivity in pigs • Major genes tend to be deleterious and are at very low frequencies in unselected populations, and contribute little to Var(A)
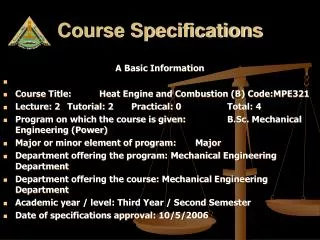
Genes for Genetic modification of muscling “Natural” mutations in the myostatin gene in cattle
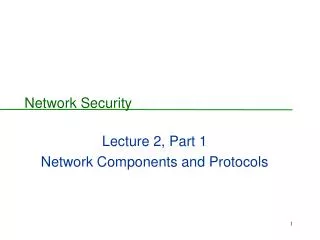
“Booroola” gene in sheep increasing ovulation rate Merino Sheep
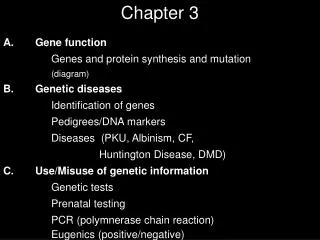
Major genes for mouse body size The mutations ob or db cause deficiencies in leptin production, or leptin receptor deficiencies
Major Genes and Isoalleles What is the genetic basis for quantitative variation? Honest answer --- don’t know. One hypothesis: isoalleles. A locus that has an allele of major effect may also have alleles of much smaller effect (isoalleles) that influence the trait of interest. Structural vs. regulatory changes Structural: change in an amino acid sequence Regulatory: change affecting gene regulation General assumption: regulatory changes are likely more important
Cis-acting locus. The allele influences The regulation of a gene on the same DNA molecule Trans-acting locus. This locus influences genes on other chromosomes and non-adjacent sites on the same chromosome Cis vs. trans effects Cis effect --- regulatory change only affects gene (tightly) linked on the same chromosome Trans effect --- a diffusible factor that can influence regulation of unlinked genes
CIS-modifiers MASTER modifiers TRANS-modifiers Genomic location of genes on array Genomic location of mRNA level modifiers
Polygenic Mutation For “normal” genes (i.e., those with large effects) simply giving a mutation rate is sufficient (e.g. the rate at which an dwarfing allele appears) For alleles contributing to quantitative variation, we must account for both the rate at which mutants appear as well as the phenotypic effect of each Mutational variance, Vm or s2m - the amount of new additive genetic variance introduced by mutation each generation Typically Vm is on the order of 10-3 VE
Simple Tests for the Presence of Major Genes Simple Visual tests: • Phenotypes fall into discrete classes • Multimodality --- distribution has several modes (peaks) Simple statistical tests • Fit to a mixture model (LR test) p(z) = pr(QQ)p(z|QQ) +pr(Qq)p(z|Qq) + pr(qq)p(z|qq) • Heterogeneity of within-family variances Select and backcross
n X p ( z ) = P r ( i ) p ( z ) i i = 1 The probability that a random individual is from class i The distributions of phenotypes conditional of the individual belonging to class i n X 2 p ( z ) = P r ( i ) ' ( z ; π ; æ ) i i i = 1 ( ) ∑ ∏ 2 1 ( z ° π ) i 2 ' ( z ; π ; æ ) = e x p ° p i i 2 2 æ 2 2 º æ i i Normal with mean m and variance s2 Mixture Models The distribution of trait value z is the weighted sum of n underlying distributions The component distributions are typically assumed normal Typically assume common variances -> 2n-1 parameters 3n-1 parameters: n-1 mixture proportions, n means, n variances
` ( z ) = P r ( Q Q ) p ( z ) + P r ( Q q ) p ( z ) + P r ( q q ) p ( z ) j Q Q j Q q j q q j 2 2 2 = P r ( Q Q ) ' ( z ; π ; æ ) + P r ( Q q ) ' ( z ; π ; æ ) + P r ( q q ) ' ( z ; π ; æ ) j Q Q j Q q j q q Mixture proportions follow from Hardy-Weinberg, e.g. Pr(QQ) = pQ* pQ m Y . . . ` ( z ) = ` ( z ; z ; ¢ ¢ ¢ ; z ) = ` ( z ) m j 1 2 j = 1 In quantitative genetics, the underlying classes are typically different genotypes (e.g. QQ vs. Qq) although we could also model different environments in the same fashion Likelihood function for an individual under a mixture model Likelihood function for a random sample of m individuals
0 1 m X 1 ° m = 2 2 2 @ A m a x ` ( z ; z ; ¢ ¢ ¢ ; z ) = ( 2 º S ) e x p ° ( z ° z ) … j m 0 1 2 2 S 2 j = 1 X 1 2 2 S = ( z ° z ) i m Likelihood Ratio test for Mixtures Null hypothesis: A single normal distribution is adequate to fit the data. The maximum of the likelihood function under the null hypothesis is The LR follows a chi-square distribution with n-2 df, where n-1 = number of fitted parameters for the mixture The LR test for a significantly better fit under a mixture is given by 2 ln (max { likelihood under mixture}/max l0 )
Complex Segregation Analysis A significant fit to a mixture only suggeststhe possibility of a major gene. A much more formal demonstration of a major gene is given by the likelihood-based method of Complex Segregation Analysis (CSA) Testing the fit of a mixture model requires a sample of random individuals from the population. CSA requires a pedigree of individuals. CSA uses likelihood to formally test for the transmission of A major gene in the pedigree
3 X 2 ` ( z j g ; g ) = P r ( g j g ; g ) ' ( z ; π ; æ ) i j f m o f m i j g o g = 1 Major-locus genotypes of parents Mean of genotype go o Phenotypic value of individual j in family i Phenotypic variance conditioned on major-locus genotype Transmission Probability of an offspring having genotype go given the parental genotypes are gf, gm. Example: code qq=3, Qq=2,QQ=1 3 3 Sum is over all possible genotypes, indexed by go =1,2,3 X X ` ( z ) = ` ( z j g ; g ) ( g ; g ) ( g = 3 j g = 1 ; g = 2 ) = ( q q j g = Q Q ; g = Q q ) = 0 i ¢ i ¢ f m f m o f m f m g g = 1 = 1 ( g = 2 j g = 1 ; g = 2 ) = ( Q q j g = Q Q ; g = Q q ) = 1 = 2 f m o f m f m n Sum over all possible parental genotypes Y i ( g = 1 j g = 1 ; g = 2 ) = ( Q Q j g = Q Q ; g = Q q ) = 1 = 2 o f m f m ` ( z j g ; g ) = ` ( z j g ; g ) i ¢ f m i j f m Conditional family likelihood j = 1 Building the likelihood for CSA Start with a mixture model Difference is that the mixing proportions are not the same for each individual, but rather are a function of its parental (presumed) genotypes Likelihood for family i
- - P r ( q q j g ; g ) = ( 1 ° ø ) ( 1 ° ø ) f m g g f m - - P r ( Q q j g ; g ) = ø ( 1 ° ø ) + ø ( 1 ° ø ) f m g g g g m m f f P r ( Q Q j g ; g ) = ø ø f m g g f m Probability that the father transmits Q Probability that the mother transmits Q Transmission Probabilities Explicitly model the transmission probabilities Formal CSA test of a major gene (three steps): • Significantly better overall fit of a mixture model compared with a single normal • Failure to reject the hypothesis of Mendelian segregation : tQQ = 1, , tQq = 1/2, tqq = 0 • Rejection of the hypothesis of equal transmission for all genotypes (tQQ = tQq = tqq )
2 3 n 3 Y X i 2 4 5 ` ( z j g ; g ; c ) = P r ( g j g ; g ) ' ( z ; π + c ; æ ) i f m i o f m i j g i j o j j g = 1 = 1 o j Z 1 2 ` ( z j g ; g ) = ` ( z j g ; g ; c ) ' ( c ; 0 ; æ ) d c i f m i f m c ° 1 Z 1 2 ` ( z ) = ` ( z j c ) ' ( c ; 0 ; æ ) d c i i c ° 1 2 3 Z n 1 Y ( ° ¢ ° ¢ ) i ) ( 2 2 4 5 = ' z ; π + c ; æ ' c ; 0 ; æ d c i j c ° 1 j = 1 CSA Modification: Common Family Effects Families can share a common environmental effect Expected value for go genotype, family i is mgo + ci Likelihood conditioned on common family effect ci Unconditional likelihood (average over all c --- assumed Normal with mean zero and variance sc2 Likelihood function with no major gene, but family effects
Maps and Mapping Functions The unit of genetic distance between two markers is the recombination frequency, c If the phase of a parent is AB/ab, then 1-c is the frequency of “parental” gametes (e.g., AB and ab), while c is the frequency of “nonparental” gametes (e.g.. Ab and aB). A parental gamete results from an EVEN number of crossovers, e.g., 0, 2, 4, etc. For a nonparental (also called a recombinant) gamete, need an ODD number of crossovers between A & b e.g., 1, 3, 5, etc.
Hence, simply using the frequency of “recombinant” (i.e. nonparental) gametes UNDERESTIMATES the m number of crossovers, with E[m] > c In particular, c = Prob(odd number of crossovers) Mapping functions attempt to estimate the expected number of crossovers m from observed recombination frequencies c When considering two linked loci, the phenomena of interference must be taken into account The presence of a crossover in one interval typically decreases the likelihood of a nearby crossover
c = c ( 1 ° c ) + ( 1 ° c ) c = c + c ° 2 c c A C A B B C A B B C A B B C A B B C Probability(odd number of crossovers btw A and C) Odd number of crossovers btw A & B and even number between B & C Even number in A-B, odd number in B-C c = c + c ° 2 ( 1 ° ± ) c c A C A B B C A B B C Interference parameter Suppose the order of the genes is A-B-C. If there is no interference (i.e., crossovers occur independently of each other) then We need to assume independence of crossovers in order to multiply these two probabilities When interference is present, we can write this as • = 0 --> No interference. Crossovers occur independently of each other d = 1 --> complete interference: The presence of a crossover eliminates nearby crossovers
- - 1 1 X X - k ° m 2 + 1 2 m 1 ° e ° m c = p ( m ; 2 k + 1 ) = e = ( 2 k + 1 ) ! 2 k k = 0 = 0 Odd number Prob(Odd number of crossovers) This gives the estimated Haldane distance as l n ( 1 ° 2 c ) m = ° 2 Mapping functions. Moving from c to m Haldane’s mapping function (gives Haldane map distances) Assume the number k of crossovers in a region follows a Poisson distribution with parameter m This makes the assumption of NO INTERFERENCE Pr(Poisson = k) = lk Exp[-l]/k! l = expected number of successes Usually reported in units of Morgans or Centimorgans (Cm) One morgan --> m = 1.0. One Cm --> m = 0.01
Linkage disequilibrium mapping Idea is to use a random sample of individuals from the population rather than a large pedigree. Ironically, in the right settings this approach has more power for fine mapping than pedigree analysis. Why? Key is the expected number of recombinants. in a pedigree, Prob(no recombinants) in n individuals is (1-c)n LD mapping uses the historical recombinants in a sample. Prob(no recomb) = (1-c)2t, where t = Time back to most recent common ancestor
Expected number of recombinants in a sample of n sibs is cn Expected number of recombinants in a sample of n random individuals with a time t back to the MRCA (most recent common ancestor) is 2cnt Hence, if t is large, many more expected recombinants in random sample and hence more power for very fine mapping (i.e. c < 0.01) Because so many expected recombinants, only works with c very small
New mutation arises on red chromosome Fine-mapping genes Suppose an allele causing a large effect on the trait arose as a single mutation in a closed population Initially, the new mutation is largely associated with the red haplotype Hence, markers that define the red haplotype are likely to be associated (i.e. in LD) with the mutant allele
This linkage disequilibrium decays slowly with time if c is small Let p = Prob(mutation associated with original haplotype) p =(1-c)t Thus if we can estimate p and t, we can solve for c, c = 1- p1/t
Most frequent allele type varies between normal and DTD-bearing haplotypes 100 generations to MRCA used for Finnish population Diastrophic dysplasis (DTD) association with CSF1R marker locus alleles Hence, allele 1-1 appears to be on the original haplotype in which the DTD mutation arose --> p = 0.947 c = 1- p1/t = 1- 0.9471/100 Gives c = 0.00051 between marker and DTD. Best Estimate from pedigrees is c = 0.012 (1.2cM)
Candidate Loci and the TDT Often try to map genes by using case/control contrasts, also called association mapping. The frequencies of marker alleles are measured in both a case sample -- showing the trait (or extreme values) control sample -- not showing the trait The idea is that if the marker is in tight linkage, we might expect LD between it and the particular DNA site causing the trait variation. Problem with case-control approach: Population Stratification can given false positives.
When population being sampled actually consists of several distinct subpopulations we have lumped together, marker alleles may provide information as to which group an individual belongs. If there are other risk factors in a group, this can create a false association btw marker and trait Example. The Gm marker was thought (for biological reasons) to be an excellent candidate gene for diabetes in the high-risk population of Pima indians in the American Southwest. Initially a very strong association was observed: The association was re-examined in a population of Pima that were 7/8th (or more) full heritage: Problem: freq(Gm+) in Caucasians (lower-risk diabetes Population) is 67%, Gm+ rare in full-blooded Pima
2 ( T ° N T ) 2 ¬ = t d ( T + N T ) Transmission-disequilibrium test (TDT) The TDT accounts for population structure. It requires sets of relatives and compares the number of times a marker allele is transmitted (T) versus not-transmitted (NT) from a marker heterozygote parent to affected offspring. Under the hypothesis of no linkage, these values should be equal, resulting in a chi-square test for lack of fit:
2 ( 8 1 ° 4 5 ) 2 ¬ = = 1 0 : 2 9 ( 8 1 + 4 5 ) Scan for type I diabetes in Humans. Marker locus D2S152