Download
1 / 44
440 likes | 611 Views
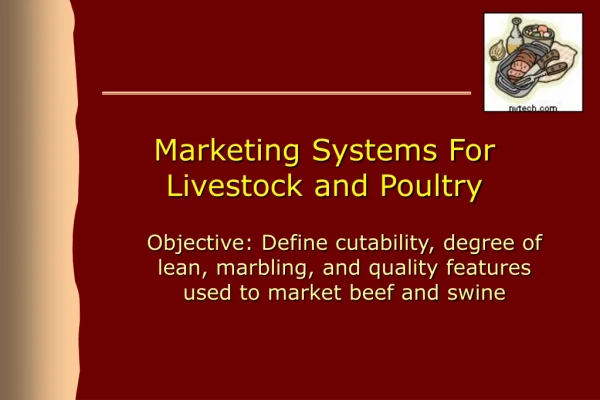
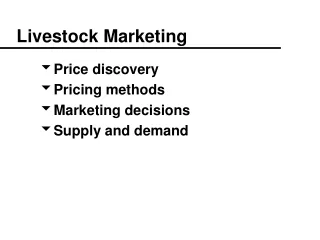
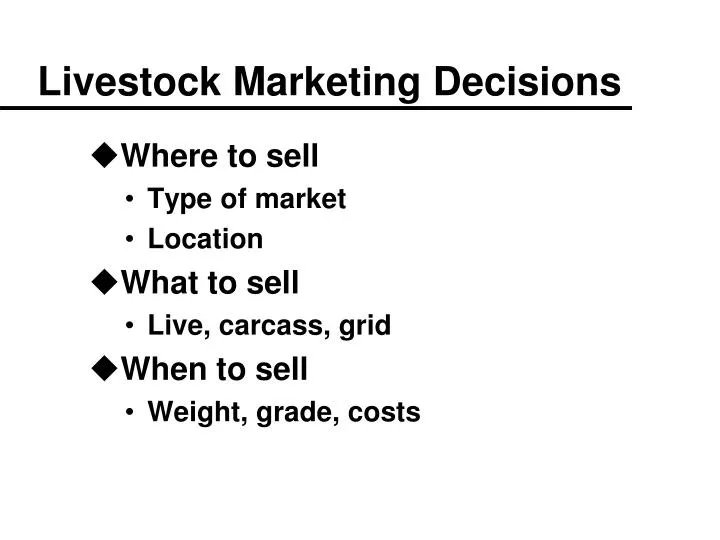
Livestock Marketing Decisions. Where to sell Type of market Location What to sell Live, carcass, grid When to sell Weight, grade, costs. What to sell. Live weight One average price for all live pounds Negotiated price before delivery or at auction Weighing conditions important

E N D
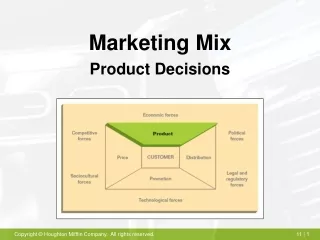
Livestock Marketing Decisions • Where to sell • Type of market • Location • What to sell • Live, carcass, grid • When to sell • Weight, grade, costs
What to sell • Live weight • One average price for all live pounds • Negotiated price before delivery or at auction • Weighing conditions important • Mud, shrink (fill, time, stress) • Was most common for hogs but not now • Still common in large cattle feedlots, less in Iowa • Used for feeder cattle and feeder pigs
What to sell • Carcass weight (“in-the-meat”) • One average price for all carcass pounds • Negotiated price before delivery • Dressing percent (also called yield) • Important to compare bids • Not important in determining value • Farmer stands risk of trimming and condemnation • Common for fed cattle in Midwest
What to sell • Dressing percent • DP = carcass weight / live weight • DP hogs approximately 73-76% • DP cattle approximately 61-64% • DP impacted by: • Weighing conditions • Shrink • Fat thickness • Genetics
What to sell • Value-based marketing • Each carcass evaluated and priced individually • Premiums and discounts determined ahead of delivery • Base price may be negotiated or come from formula • Carcasses are graded and values assigned • Farmer stands grading risk • Different buyers have different systems • Nearly all hogs • Increasingly popular for fed cattle
Hog Carcass Weight Discounts IOWA/MINNESOTA DAILY DIRECT NEGOTIATED HOG PURCHASE MATRIX LM_HG204, Fri, Aug 26, 2005, USDA Market News Des Moines, Iowa
Hog Carcass Price by Backfat and Loin Eye Area IOWA/MINNESOTA DAILY DIRECT NEGOTIATED HOG PURCHASE MATRIX LM_HG204, Fri, Aug 26, 2005, USDA Market News Des Moines, Iowa
Comparing bids Price in appropriate $/cwt A B Bid Price (live) $44.50 --- Bid Price (carcass) --- $59.50 Lean premium --- +1.25 Sort discount --- -.70 Dressing percentage 74.5 74.5 Adjusted to live 44.50 44.73 Transportation -.85 -.35 Net farm gate price $43.65 $44.38
Value-Based Cattle Marketing Three factor impact premiums • 1. Carcass Weights • 2. Quality Grade Distribution (USDA Grader) • Based on marbling, proxy for eating experience • 3. Yield Grade Distribution (USDA Grader) • Based on lean meat yield • 4. Other specs: • Product safety & quality assurance • Acceptable color • Youthfulness
Value-Based Cattle Marketing Common Ground for Targets • 1. Carcass Weights 550 - 950 lbs • 2. Quality Grade > Se+ or > Ch0 • 3. Yield Grade 1’s and 2’s
Where are the Grid Rewards & Discounts? Iowa Quality Beef Grid 2005 • Base: NE Wted Avg 65-80% Choice • Par: Ch YG3 =Base + $2.00 or Plant clean up which ever is greater • Quality Grade $/cwt • Prime: $6.00 • Certified Angus: $3.50 • Select USDA • Standard -$15.00 • Commercial -$30.00 • Dark Cutters -$30.00 • Other -$30.00 • Yield Grade $/cwt • 1: $4.00 • 2: $3.00 • 3: Par • 4: -$20.00 • 5: -$25.00 • Carcass weights $/cwt Under 500 -$40.00 • 500-549 -$15.00 • 950-999 -$8.00 • 1000 & up -$35.00
Comparing Bids ($/carcass cwt) Price in appropriate $/cwt A B Base bid price 122.00 121.00 Prime 3% --- +6.00 Top 2/3 Ch 45% --- +3.50 Select 30% --- -8.00 Yield 1&2 60% --- +2.50 Off weight 3% --- -15.00 Transportation -.65 -1.25 Net farm gate price 120.35 120.16 Bid A is a straight in the meat bid, Bid B is a valued-based bid.
When to sell • Classic production function • Optimal selling weight is where MC=MR • The cost of the next pound = the price of the next pound • Cost per pound decrease then increase with weight • Costs are a function of • Genetic potential • Cost of diet • Opportunity costs of future production • Price per pound increases then decreases • Weight discounts outside optimal range • Fatter carcasses are discounted • Adding extra weight
Market timing • Cycles • Seasonals • Marginal costs and returns
Biological and price cycles • Cycle is a pattern that repeats itself over a period longer than a year in a relatively predictable pattern
Livestock Marketing Information Center Data Source: USDA/NASS
What causes cycles • Response to economic signals • Time lag • Psychology • Biology • Investment • Livestock • Tree crops • Land development
Cattle Cycle and Timing • Prices are cyclical • Heifer cost impact profitability • Calf prices impact annual income • Two alternatives • Steady Size: Same number of heifers • Dollar Cost Averaging: Same value of heifers
Seasonal price patterns • Patterns that repeat themselves with some degree of predictability within a year’s time frame. • Driven by supply and demand factors that are impacted by time of year • Weather • Holidays • Input prices
How to calculate seasonal index • Pick time period (number of years) • Pick season period (month, quarter) • Calculate average price for season • Calculate average price over time • Divide season average by over time average price x 100
Using Seasonal Index to Forecast • Observe price in time t1 P1 • Forecast price in time t2 P2 • Start with P1/ I1 = P2 / I2 • Then P1 x I2 / I1 = P2 • Assume that cows are selling at $50/cwt in November. What is the forecast of February?
MC $ MR Weight
Cost of Production • Raised livestock • Farrow to finish, Cowherd to finish • Accumulate cost from birth through finish • Relatively stable cost over time • Impacted by input prices and production • Feed is typically 60-70% of cost • Low productivity increases the cost of those that make it to finish because the fixed costs are divided by a smaller number.
Cost of Production • Purchased feeder livestock • Derived demand for feeder animal • Highly variable price • Depends upon • Expected selling price for finished animal • Feed costs
Cost of production budgets • Starts with production function • Incorporates input prices • Project cost per unit sold • Variable $/unit • Total $/unit • http://www.extension.iastate.edu/agdm/livestock/html/b1-21.html
Using budgets in planning • Project a breakeven “point estimate” • Sensitivity analysis for key variables • Back calculate from revenue to what you can afford to pay for feeder animal • Economic v. Financial costs
Objective Based Pricing Strategy Cost/hd $/cwt 550# steer calf fed to 1200 slaughter weight
How much to pay for feeder animal • Work back from total revenue $/cwt Cost/hd 550# steer calf fed to 1200 slaughter weight