Download
1 / 12
120 likes | 143 Views
Graphing: Absolute Value Inequalities. Notes. Absolute Value Inequalities have a lot in common with Absolute Value Equations (as well as linear equations and inequalities) . Here you can see the difference is that:

E N D
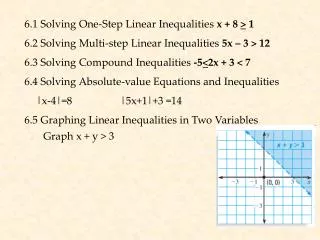
Absolute Value Inequalities have a lot in common with Absolute Value Equations (as well as linear equations and inequalities). Here you can see the difference is that: equations use an = inequalities use <, >, <, or > • For Both: • a – widens, narrows, of flips the graph • h – moves graph left ( + ) or right ( - ) (*opposite of sign) • k – moves graph up ( + ) or down ( - ) (*same as sign)
Absolute Value Inequalities have a lot in common with Absolute Value Equations (as well as linear equations and inequalities). Here you can see the difference is that: equations use an = inequalities use <, >, <, or > • For Both: • a – widens, narrows, of flips the graph • h – moves graph left ( + ) or right ( - ) (*opposite of sign) • k – moves graph up ( + ) or down ( - ) (*same as sign) • But we need to use the same “rules” for the Absolute Value Inequalities as we did for Linear Inequalities as far as the lines and shading are concerned.
The graph for both of these always “start out as” the graph of: Which looks like this: *and is basically the top half of the graphs of: y = x and y = -x For y=|x|, a=1, h=0, and k=0. and when you change the a, h, and k you are just moving the graph around the plane buy the vertex.
y = |x| (Parent function)
y = |x| (Parent function) First, a = 3, so I narrow (steepen) the graph accordingly.
y = |x| (Parent function) First, a = 3, so I narrow (steepen) the graph accordingly. Second, h = -2, so I take the vertex and move it 2 units right.
y = |x| (Parent function) First, a = 3, so I narrow (steepen) the graph accordingly. Second, h = -2, so I take the vertex and move it 2 units right. Third, k = 1, so I take the vertex and move it 1 units up.
y = |x| (Parent function) Fourth, the sign is < so I know the lines need to be solid, and I adjust my lines.
Fourth, the sign is < so I know the lines need to be solid, and I adjust my lines. Finally, the sign is < so I know I need to shade below.