Download
1 / 8
80 likes | 210 Views
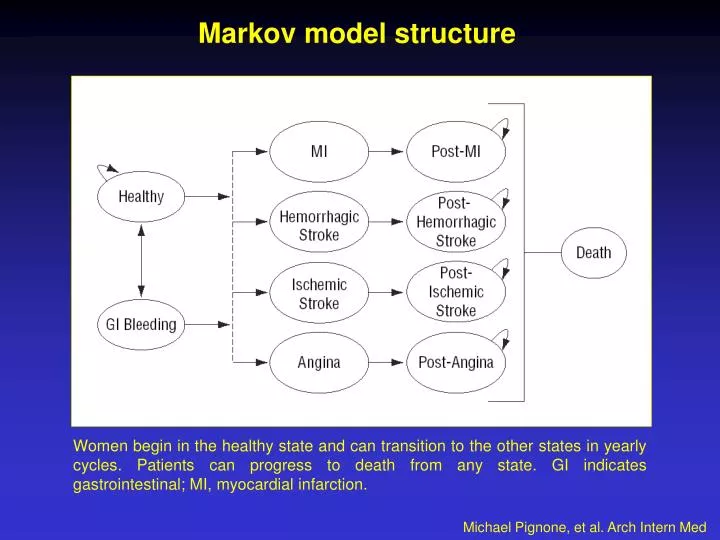
Markov model structure. Women begin in the healthy state and can transition to the other states in yearly cycles. Patients can progress to death from any state. GI indicates gastrointestinal; MI, myocardial infarction. Michael Pignone, et al. Arch Intern Med.

E N D
Markov model structure Women begin in the healthy state and can transition to the other states in yearly cycles. Patients can progress to death from any state. GI indicates gastrointestinal; MI, myocardial infarction. Michael Pignone, et al. Arch Intern Med
Base Case Estimates and Ranges Used in Sensitivity Analyses* Michael Pignone, et al. Arch Intern Med
Variation in cost per QALY gained with aspirin compared with no treatment across the range of potential values for the relative risk of ischemic stroke Variation in cost per quality-adjusted life-year (QALY) gained with aspirin compared with no treatment (represented on the y-axis) across the range of potential values for the relative risk of ischemic stroke in those taking aspirin (represented on the x-axis). The vertical broken line represents the base case value. Costs are expressed in 2005 US dollars. Michael Pignone, et al. Arch Intern Med
Variation in cost per QALY gained with aspirin compared with no treatment across the range of potential values for the relative risk of myocardial infarction (MI) Variation in cost per quality-adjusted life-year (QALY) gained with aspirin compared with no treatment (represented on the y-axis) across the range of potential values for the relative risk of myocardial infarction (MI) in those taking aspirin (represented on the x-axis). The vertical broken line represents the base case value. Costs are expressed in 2005 US dollars. Michael Pignone, et al. Arch Intern Med
Variation in cost per QALY gained with aspirin compared with no treatment across the range of potential values for the excess risk of gastrointestinal bleeding Variation in cost per quality-adjusted life-year (QALY) gained with aspirin compared with no treatment (represented on the y-axis) across the range of potential values for the excess risk of gastrointestinal bleeding in those taking aspirin (represented on the x-axis). The vertical broken line represents the base case value. Costs are expressed in 2005 US dollars. Michael Pignone, et al. Arch Intern Med
Variation in cost per QALY gained with aspirin compared with no treatment across the range of potential values for the utility of taking aspirin Variation in cost per quality-adjusted life-year (QALY) gained with aspirin compared with no treatment (represented on the y-axis) across the range of potential values for the utility of taking aspirin (represented on the x-axis). The vertical broken line represents the base case value. Costs are expressed in 2005 US dollars. Michael Pignone, et al. Arch Intern Med
Probabilistic sensitivity analysis and cost-effectiveness acceptability curve. A, Results of the probabilistic sensitivity analysis for the base case of 65-year-old women at moderate cardiovascular risk Results of the probabilistic sensitivity analysis for the base case of 65-year-old women at moderate cardiovascular risk. Each dot represents 1 iteration of the model. The y-axis represents incremental costs of aspirin compared with no therapy. The x-axis represents net quality-adjusted life-years (QALYs) with aspirin compared with no therapy. The diagonal line represents a cost per QALY gained of $50 000 in quadrant Michael Pignone, et al. Arch Intern Med
Probabilistic sensitivity analysis and cost-effectiveness acceptability curve. Results of the probabilistic sensitivity analysis for the base case of 65-year-old women at moderate cardiovascular risk Results of the probabilistic sensitivity analysis for the base case of 65-year-old women at moderate cardiovascular risk. B - The y-axis represents the probability that the cost per QALY gained is less than or equal to the values listed on the x-axis. ICER indicates incremental cost-effectiveness ratio. Michael Pignone, et al. Arch Intern Med