Download
1 / 23
230 likes | 354 Views
ESnet Abilene 3+3 Measurements. Presented at the Joint Techs Meeting in Columbus July 19 th 2004 Joe Metzger ESnet Network Engineer metzger@es.net. Chin Guok, Bill Johnston & Kevin Oberman@ ESnet Chintan Desai & John Moore @ NCSU Darryl Wohlt & Phil Demar @ FERMI

E N D
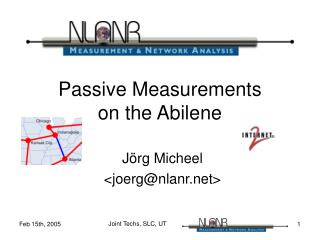
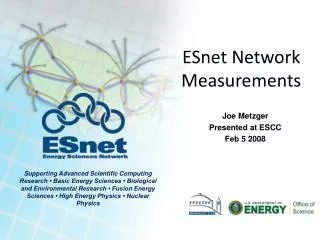
ESnet Abilene 3+3 Measurements Presented at the Joint Techs Meeting in Columbus July 19th 2004 Joe Metzger ESnet Network Engineer metzger@es.net
Chin Guok, Bill Johnston & Kevin Oberman@ ESnet Chintan Desai & John Moore @ NCSU Darryl Wohlt & Phil Demar @ FERMI Jeff Boote, Eric Boyd & Guy Almes @ Internet2 Jin Guojun @ LBL Kevin Walsh @ SDSC Prasad Calyam @ OSU / OARnet Collaborators
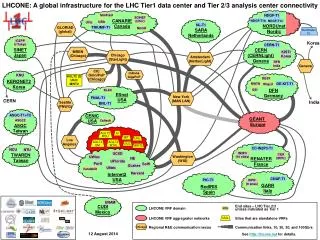
3 ESnet Sites LBL FERMI BNL 3 Abilene Participants SDSC NCSU OSU 3+3 Measurements Abilene and ESnet have systems in place to measure our portions of the net. We were not measuring performance across our interconnections.
Why? • We want to ensure that the ESnet/Abilene cross connects are serving the needs of users in the science community who are accessing DOE facilities and resources from universities or accessing university facilities from DOE labs.
Existing Measurement Collections were not meeting our needs. • ESnet and Abilene monitor traffic, errors and discards on all of our respective links including interconnection points. • This monitoring shows interconnections are lightly loaded and error free. • Other measurement systems we looked at do not contain the mix of ESnet and Abilene sites we are looking for.
Why Start with Latency Testing? • Low Impact • Sensitive to network events
What is OWAMP • One Way Measurement Protocol • http://www.ietf.org/internet-drafts/draft-ietf-ippm-owdp-08.txt • A suite of tools • http://e2epi.internet2.edu/owamp/
Data Visualization • What is the best way to display latency data? • It is difficult to identify trends in numeric tables. • What is interesting or meaningful? • Mean? • No. • Median and 95th percentiles? • Maybe… • Distribution? • Yes!
SmokePing by Tobias Oetiker • http://www.smokeping.org • Shows distribution of latency measurements.
Our Visualizations • Extended SmokePing graphic design to include multiple data sets on one graph. • SmokePing uses 20 shades of gray and plots one data set on a graph. • We are using a different color for each data set on a graph. • We are using different saturations of the colors to show the distribution of results. • Show NTP error estimates. • Graphs implemented as RRD templates to leverage existing ESnet statistics tools & infrastructure. • Do not show loss information at this time.
Red: FERMI to LBLBlue: LBL to FERMI Clock Event A couple packets experienced queuing delays Green NTP Error Estimates
Measurement Servers • LBL and NCSU were ready in late April • FNAL and SDSC in May • OSU in June • BNL in July
Interesting Observations • NTP Error Estimate Quality • NCSU Metro DWDM Reroute • Queuing caused by bandwidth testing • Asymetric Routing
NCSU Metro DWDM RerouteAdds about 350 Micro Seconds Fiber Re-Route
Bandwidth Tests Can Cause Queuing on Bottleneck Links Large Data Transfers Test Traffic Rerouted Tuesday Morning
Asymetric Routing betweenFERMI and SDSC(LBL to CENIC link Maintenance)
Future Direction • Utilize a generalized, interoperable measurement collection and archiving system instead of current ad-hoc scripts. • Look carefully at implementing bandwidth testing, perhaps using Scavenger QOS.
Conclusions • The ESnet/Abilene interconnections are not the bottlenecks on the tested paths. • Latency data can show interesting queuing effects that may not be obvious in other measurements. • A single user with a $5K box can congest many current access links.
The End • For more info see http://measurement.es.net