Download
1 / 33
330 likes | 471 Views
Federal Consulting Group. National Weather Service Marine/Tropical Survey Presentation of Customer Satisfaction Results March 16, 2004. Introduction. Snapshot of the American Customer Satisfaction Index (ACSI). The #1 national economic indicator of customer satisfaction

E N D
Federal Consulting Group National Weather Service Marine/Tropical Survey Presentation ofCustomer Satisfaction Results March 16, 2004
Snapshot of the American Customer Satisfaction Index (ACSI) • The #1 national economic indicator of customer satisfaction • Compiled by the National Quality Research Centerat University of Michigan since 1994 usingmethodology licensed from CFI Group • Measures 30 industries, 180+ organizations covering 75% of the U.S. economy • Over 70 U.S. Federal Government agencies have used ACSI to measure more than 120 programs/services • Advanced methodology quantifiably measures and links satisfaction levels to performance and prioritizes actions for improvement • Results from all surveys are published quarterly in The Wall Street Journal
Aviation (pilots and dispatchers) – completed • Media – completed • Emergency managers – completed • Marine/Tropical – completed Scope of the 2003 NWSCustomer Satisfaction Program • Four segments measured in 2003
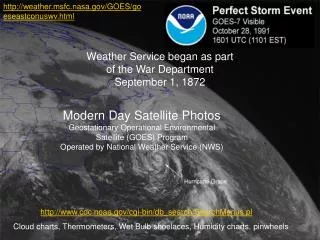
Project Background • Target segment: Users of Marine and Coastal, Tropical, and/or Great Lakes products and services, including recreational boaters, coastal residents, beachgoers, and professionals. • Survey content: Survey designed over July and August 2003, with feedback from process owners in NWS (Silver Spring and regions). • Survey method: The survey was conducted online and hosted on CFI Group’s secure server. • Customers contacted: NWS publicized the survey to interested parties and provided links to the survey on multiple web sites, including the National Hurricane Center. • Response totals: The online survey accepted responses from September 9 through October 6, 2003. Completed a total of 6298 interviews.
Isabel Survey link removed from NHC site Completed Surveys, by Date
Who Are the Marine Respondents? Most-Used Products: Marine and Coastal
Usefulness of Dissemination Methods 97% of respondents rate land methods 58% of respondents rate sea methods
CSI Comparison across Government Agencies Customer Satisfaction Index (CSI) scores are based on three questions:• Overall satisfaction with products and services • Products and services compared to expectations • Products and services compared to ideal
Satisfaction ScoresPrimary Marine Activity 1% of resp. 82 Law enforcement 81 Passenger transport 1% of resp. 81 Coastal resident 29% of resp. 81 Beachgoer 12% of resp. 79 Science/research 4% of resp. 79 Search and rescue 2% of resp. Freight transport 78 1% of resp. 78 Other 15% of resp. 75 Recreational boater 34% of resp. 73 Commercial fishing 1% of resp.
INPUTS SATISFACTION OUTPUTS Great Lakes Marine Forecasts Quality of Forecasts Timelines of Forecasts Great Lakes Short-Fused And Other Forecasts Quality of Short Term Forecasts Timelines of Short Term Forecasts Great Lakes Ice Forecasts Quality of Ice Freeze-up Outlooks Timelines of Ice Break-up Outlooks Usefulness of tropical forecast products Ease of understanding tropical forecast products NHC Forecasts Tropical Warnings and Watches Clarity and utility of hurricane and tropical storm watches and warnings Contact NWS Hurricane Local Statements How well HLSs support mission needs in geographic area of interest Contacted NWS to report problem or make suggestion Coastal /Offshore/High Seas Forecasts Quality of Forecasts Timelines of Forecasts Take Action Customer Satisfaction Likelihood to take action based on NWS information NWS overall NWS vs. expectations NWS vs. ideal Marine/Coastal Short-Fused and Other Forecasts Quality of Short Term Forecasts Timelines of Short Term Forecasts Confidence in NWS Coastal Flood and Surf Zone Information Quality of Area Forecast Discussions Timelines of Special Marine Warnings Confidence in NWS Marine Forecast Accuracy Accuracy of Marine Warnings Overall accuracy of the Marine Forecasts General Forecast Performance Ease of understanding the data provided Ease of reading charts and graphs Timelines of warnings broadcast over NOAA Weather Radio Frequency of forecast updates General Forecast Availability General Forecast Verification Frequency NWS forecast events occur within six hours of predicted time frame NWS Marine CSI Model
76 0.9 78 0.3 Impact: Measures leverage of component on target variable. If NHC Forecasts improves 5 points, CSI will improve 0.9 points. Score: Measures performance on a 0-100 scale. 63 0.0 85 0.9 85 0.5 13% 80 0.1 78 90 76 0.6 87 79 0.4 78 0.0 74 0.9 78 0.7 76 0.4 69 0.5 NWS Marine Model INPUTS SATISFACTION OUTPUTS Great Lakes Marine Forecasts Great Lakes Short-Fused And Other Forecasts Great Lakes Ice Forecasts NHC Forecasts Tropical Warnings and Watches Contact NWS Hurricane Local Statements Take Action Customer Satisfaction Coastal /Offshore/High Seas Forecasts Marine/Coastal Short-Fused and Other Forecasts Confidence in NWS Coastal Flood and Surf Zone Information Marine Forecast Accuracy General Forecast Performance General Forecast Availability General Forecast Verification
NHC ForecastsImpact on CSI: 0.9 • The usefulness of additional probabilistic information is rated an 86 – very useful • When asked which area needs improvement most, 51% of respondents say ‘Track’. No other feature is mentioned more than 11% of the time.
Tropical Warnings and WatchesImpact on CSI: 0.5 • Most-mentioned minimum desired probability associated with a watch: 30% • Most-mentioned minimum desired probability associated with a warning: 70% • 50% of respondents prefer break points over county boundaries, and 28% are indifferent
What Customers Want • Customers express a clear preference for graphical forecasts. • A constantly-evolving forecast is preferred over a regularly-scheduled forecast, 79% to 21%.
What Customers Want (cont.) • When asked if they want any weather information not currently provided by NWS, 82% say no. • Needs are varied, from better barometric readings to more accurate lightning forecasts to better wave forecasts.
Recommendations • Keep up the good work! (e.g., Isabel forecasting) • Improve perceived forecast accuracy by increasing the number of official forecasts • Give customers more information to explain the forecast data • Educate customer regarding reasonable expectations, especially with wave height and period forecasts • As in the Media survey, improve the consistency of Area Forecast Discussions and terminology use • Ensure storm track is a top priority for tropical/hurricane forecasts • Focus on graphical products, but keep in mind that radio is still a dominant method of information acquisition • Examine possible causes of lower scores for Great Lakes Ice and Coastal Surf Zone forecasts • Consider how different regions/users may respond to the survey differently • These overall findings will have varying applicability to specific sub-populations
For More Information Brian LaMarre, NOAA Marine Program Manager (301) 713-1677 x108 Brian.LaMarre@noaa.gov Doug Helmreich, CFI Group Senior Consultant (734) 623-1321 dhelmreich@mail.cfigroup.com Bernie Lubran, Federal Consulting Group Project Manager (202) 906-5642 bernie.lubran@ots.treas.gov