Download
1 / 52
540 likes | 582 Views
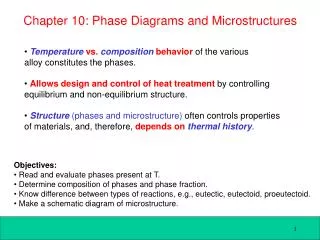
PHASE TRANSFORMATIONS & MICROSTRUCTURES. Introduction

E N D
PHASE TRANSFORMATIONS & MICROSTRUCTURES
Introduction Material properties are largely determined by their microstructureThe equilibrium phase diagrams allow to determine, at equilibrium, the number, the composition and the volume fraction of the different phases in function of temperature. Phase diagrams do not give any information on the kinetics of phase transformations, i.e. on the time to form new phases when changing temperature or pressure acting on the studied system.Any phase transformation, such as crystallization, involves reorganization of atoms or molecules, hence this is the mobility of atoms or molecules in the liquid state and in the solid state that control to a large extent the formation of microstructures.Diffusion phenomena, i.e. migration of atoms or molecules in materials in liquid or solid state, are the phenomena that determine the kinetic of a large number of phase transformations.
Solid State Diffusion Interstitial solid solutions: small diameter atoms (C, H, N) occupy a number of interstitial sites of the crystal lattice. These small atoms move easily along the channels formed by the alignment of vacant interstitial sites in the crystal.Substitutional solid solution: atoms or molecules of dissolved substances occupy one crystal lattice site. In this case, the movement of a dissolved species is accompanied by the displacement of an atom or a molecule of solvent. The diffusion process is much slower because this diffusion mechanism involves vacancies existing in the crystalline lattice (It is also the case for self-diffusion which involves the exchange of atoms or molecules of the same specie).For an atom, a molecule or a segment of a molecule, located in the vicinity of a vacancy, to be bale to move, it must have sufficient energy to slightly displace the atoms, molecules or segments of f their equilibrium position. Therefore, the diffusion phenomenon implies to overcome a potential energy barrier.
Random and reversible movement of an atom in the vicinity of a vacancy in the crystal lattice. Change in potential energy during the atom transition. It is an activated process favored by (i) a raise in temperature and (ii) a weak binding energy • = cste · Xl· PE n = frequency or probablilty of the jump/transition Xl = vacancies concentration PE = probability to have an energy E (i.e. probability to have sufficient energy for the displacement to occur)
DGf = free enthalpy (Gibbs free energy) of formation of a vacancy DHf = enthalpy of formation of a vacancy In the case of solids, DHf is of the order of 100 kJ / mole Since The second exponential is temperature independent The jump frequency is therefore: B et C are constants and DHt is the activation enthalpy of migrationof the vacancy (also of the order of 100 kJ / mol vo is in first approximation, temperature independent
substitutional solution: the variation of the speed of diffusion with temperature results from the superposition of two phenomena, i.e. the variation of the number of vacancies (DHf) et of their mobility (DHt). Interstitial diffusion(e.g.: C in Fe): The diffusion sites already exist; only overcoming the potential barrier caracterised by DHt has to be considered. At 900 ° C, the hopping frequency (T) of the carbon atoms in a mild steel (low carbon stell: 0.1% C)is equal to 109s-1, while the vibration frequency of these atoms in the crystal is 1013s-1.There is therefore on average only one oscillation out of 10 000 that causes the translation of an atom. Since each jump results in a displacement of approximately an interatomic distance (0.3 nm), the speed of the moving atoms at a temperature of 900 ° C is of the order of 0.3 m / s (1 km / h). Note that these displacements are made randomly, as in the case of Brownian motion, thus the effective displacement of an atom is very small.
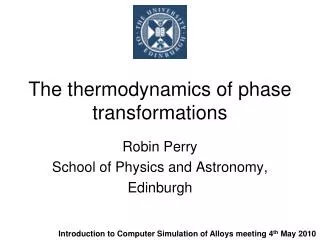
Adolf Eugen Fick From Wikipedia, the free encyclopedia Adolf Eugen Fick (3 September 1829, Kassel, Hesse-Kassel – 21 August 1901) was a German born Physician and physiologist. He began his work in the formal study of mathematics and physics and then realized an aptitude for medicine. He earned his doctorate in medicine at Marburg in 1851. As a newly minted Doctor he began his work as a Prosector of Anatomy. In 1855 he introduced Fick's law of diffusion, which governs the diffusion of a gas across a fluid membrane. In 1870 he was the first to measure cardiac output, called the Fick principle. Fick managed to double-publish his law of diffusion, as it applied equally to physiology and physics. His work led to the development of the direct Fick method for measuring Cardiac Output. Fick also invented the tonometer, work that influenced his nephew Adolf Gaston Eugen Fick who invented the contact lens.
1ère Fick Law (first law of diffusion) When a concentration gradient is present in a phase, The atoms or molecules mobility generates a flux of matter in the direction of the gradient, which tends to decrease the free enthalpy of the system and to equalize the concentrations. There is a simple relationship between the number N of atoms or molecules passing per unit time (flow), through a unit section perpendicular to the x-axis and the concentration gradient (dc / dx) along the x axis. (first Fick Law) The proportionality factor is the Diffusion coefficient D[m2s-I]. The negative sign is introduced to take into account the fact that the flux and the gradient are of opposite directions.
Le diffusion coefficient is a measure of the mobility of the atoms; D is directly proportional to the jump frequency n(T). Q = enthalpy (energy) of activation of diffusion T = temperature [K] Substitutional diffusion via vacancies e, Q = sum of DHt and DHf. Interstitial mechanism (e.g. C in Fe), ony DHt is considered.
At 900 ° C, the hopping frequency (T) of the carbon atoms in a mild steel (low carbon stell: 0.1% C)is equal to 109s-1, while the vibration frequency of these atoms in the crystal is 1013s-1.There is therefore on average only one oscillation out of 10 000 that causes the translation of an atom. Since each jump results in a displacement of approximately an interatomic distance (0.3 nm), the speed of the moving atoms at a temperature of 900 ° C is of the order of 0.3 m / s (1 km / h). In the case of an organic glass, it was calculated that n(T) was close to 1 s-1 at the glass transition temperature Tg. Note that in case of polymers, the diffusion movements involve segments of chains that are about the size of the constituent unit and not the whole macromolecule. Indeed, it would be highly unlikely to find vacancies the size of a macromolecule in condensed phases, which normally contains between 1,000 and 20,000 catenary atoms. The vacancy concentration increases abruptly at the melting point. In case of liquids, the diffusion of atoms or of dissolved molecules as well as self-diffusion is much faster than for solids. In particular, the increase in self-diffusion coefficient is associated with a decrease in viscosity.
[J] = # / m2 s1 = m-2 s-1 [c] = # / m3 = m-3 Volume dV = A dx (assume A=1) Out (during dt): J(x+dx) dt dx In (during dt): J(x) dt Bilan: D# = Dc DV = dc dV = [J(x) - J(x+dx)] dt = - dJ(x) dt dc dV = dc (d(Ax)) = A dc dx = - dJ(x) dt; since J(x) = - D (dc/dx) dc dx = d(D (dc/dx)) dt = D d(dc/dx)) dtdc/dt = D (d2c/dx2) 2nd Fick Law (second law of diffusion) When in a system, the local concentration of the diffusing substance changes in time resulting in a time varying concentration gradient, there is an alteration of the material flux. In case of unidirectional diffusion through a unit cross-section perpendicular to the x axis, the variation of the flux dJ / dx is expressed by: The increase of the concentration c in a small volume element of thickness dx during the time dt is equal to the decrease in the flux through this volume element: Assuming that D does not depend on concentration, the unidirectional diffusion can be written: (second Fick law) The change in concentration at one point is all the more rapid as the second derivative with respect to the distance (curvature of the concentration field) is high.
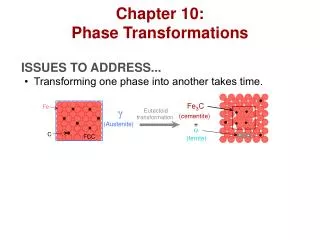
PHASE TRANSFORMATIONS For a phase transformation to take place, it is necessary that the free energy of the system decreases during the process (DG< 0). However, this condition is far from being sufficient. Indeed, the transformation from one phase into another is generally done by a mechanism of nucleation and growth. At the beginning of the transformation, there is formation of nuclei of the new phase, which are small volume elements that have the same structure as the phase being formed and which are separated from the untransformed phase by a high-energy interface. These germs, which are characterized by a high area to volume fraction, initially have a higher free energy of formation than the phase in transformation. BUT the phase transformation preferred is the one that is characterized by the faster kinetics, and the microstructure which forms is rarely the one with the lowest free energy. This is the case for crystallization, which is the most important physical transformation for the study of materials. Crystallization gives rise to a wide variety of microstructures, in particular when dealing with alloys and when there may be formation of several solid phases of different structures.
NUCLEATION The nucleation of a new phase is the result of atomic or molecular fluctuations occurring in the transforming phase. Unstable nanoscopic islands randomly appears, some of which have the structure of the new forming phase. The vast majority of these nanoscopic islands, which have a high specific area, are unstable and disappear in the course of the random fluctuations. There is only one very small number of islands that reach a sufficient critical size to further develop. Homogeneous nucleation: The continuous formation from a homogeneous set of atoms of randomly distributed homogeneous islets is observed, dispersed in the molten material. The nucleation occurs during the whole duration of the process and the resulting grains observed are of varying sizes (wide size distribution).
Heterogeneous Nucleation The initiation of a new phase is generally facilitated by the presence of foreign particles of microscopic size (impurities) that are always present in greater or lesser amount in the phase in transformation. In the vicinity of the surface of another crystalline phase (an inclusion by example), the free enthalpy of formation of the germ is reduced. The beginning of the phase transformation occurs at the surface of the foreign particle. This nucleation is said heterogeneous. The exact mechanism of the nucleation induced by foreign particles is not accurately known. At each temperature, there is only very small fraction of the impurities which is active. From the beginning of the transformation, the crystal growth of the new phase occurs on these active germs: The heterogeneous nucleation is generally instantaneous and the observed grains have then a very similar size (reduced size distribution).
The appearance within the liquid phase of a nuclei of volume V and surface S’ comes with a free enthalpy variation DGg, in which a volume component and a surface component can be distinguished: { always > 0 DGvrepresents the free energy of formation of the new phase per unit volume, and DGS, the specific interfacial free energy, i.e. the free energy variation at constant T and P per unit area of interface formed. This quantity is always positive, the formation of the interface is an endothermic phenomenon. Dgv et Dsvare respectively the enthalpy and entropy of formation of the new phase per unit volume. For crystallization, these two quantities are negative.
At the thermodynamic melting temperature Tm, the free enthalpy of formation (DGv ou Dgv) is equal to zero (i.e. Dsv= Dhv/Tm ) For a physical transformation such as crystallization to spontaneously occur, the actual system temperature need to be smaller than the thermodynamic equilibrium temperature at which the transformation should happen. In the case of crystallization, the system should be at a temperature T < Tm and the transformation starts only when the system reaches a certain degree of supercoolingDT = Tm - T. Since DGs is always positive, it is absolutely necessary that the volume term DGv, or the specific volume term Dgv, be negative at the temperature of the transformation. The free specific enthalpy of formation Dgv is more and more negative when the degree of supercooling DT increases. This is the origin of the driving force of the phase transformation. In the vicinity of Tm, the variation of the volume free specific enthalpy of formation can be approximated by a linear variation, i.e. que Dh et Ds are constant within the temperature range considered.
For a spherical nuclei of radius r Critical radius r* for the free enthalpy of formation of the nuclei to start decreasing as a function of r and for a stable phase to form.
However, we failed to take into account in our calculations the fact that the nuclei are not formed in the system in isolation. When n nuclei of radius r that form, we must not only consider in the calculation of the the free enthalpy, the change in free energy of formation of each nuclei, but also a change in entropy of the system related to the random apparition and random distribution of n nuclei of radius r among the atoms and molecules of the system. This free enthalpy variation DG = DH-TDSn is negative, where DSn is the configurational variation of entropy (entropy of mixing) which results from the dispersion of the nuclei of the forming phase in the system. Considering the increasing number of configuration (increased configurational entropy) resulting from the formation of new nuclei, we show that for any temperature T < Tm, the Gibbs free energy change of the system DG resulting from the formation of nuclei of the new phase passes through a minimum for a given value of the number of nuclei ne. As in the case of vacancies where an equilibrium number or concentration of vacancies can be determined, and replacing in the calculation Xl the molar fraction of vacancies or vacancies concentration with Xn the molar concentration of nuclei of the new phase, a well determined number of nuclei nr of radius r per unit volume can determined for each temperature at equilibrium. This leads us to introduce the concept of nucleation rate I, representing the number of stable nuclei formed per unit volume and per unit time. Nucleation rate I = number of stable nuclei form per unit volume and per unit time? [m-3s-1] (increases drastically with the degree of supercooling DT). When an atom, a molecule binds to the growing nuclei, it moves and must pass through a potential barrier DGt similar to the one involved in diffusion. The rate of nucleation is dependent on both a transport term and a thermodynamic term. In general, the nucleation rate can be represented by the expression: The thermodynamic term express the driving force of the transformation and its value depends on the free enthalpy of formation of the nuclei. The value is zero when the degree of supercooling = 0 and it increases when DT increases, i.e. when temperature decreases. Le transport term depends on the speed of the atoms or molecules motion, on their mobility, and this term exponentially decreases when temperature decreases.
The thermodynamic factor and transport term therefore have an antagonistic effect on the nucleation rate. The nucleation rate therefore passes through a maximum for a fixed value of the temperature Tmax and vanishes at the temperature Tm where the free enthalpy of formation of nucleai becomes infinite
Heterogeneous Nucleation The initiation of a new phase is generally facilitated by the presence of foreign particles of microscopic size (impurities) which are always present in greater or lesser amount in the phase transformation. In the vicinity of the surface of another crystalline phase (an inclusion for instance), the free enthalpy of formation of the nuclei is reduced. The phase transformation starts at the surface of the foreign particle. We say that germination is heterogeneous. The exact mechanism of nucleation induced by foreign particles is not precisely known. At each temperature, there is only a very small fraction of the impurities which is active. From the beginning of the transformation, the crystal growth occurs only on these active sites. heterogeneous nucleation is generally instantaneous.
Heterogeneous Nucelation The main effect of heterogeneous nucleation is to lower the free Gibbs activation energy. The critical radius of formation of a nuclei stays the same as in homogeneous nucleation Variation of the free enthalpy with the radius of the nuclei Variation of the critical free enthalpy withtemperature
Heterogeneous Nucelation For heterogeneous nucleation, surface interactions with the substrate have to be taken into account. où
Croissance à l’échelle atomique - Énergie de liaison More dangling bonds More favorable site of nucleation and growth
Croissance à l’échelle atomique An atom or a molecule binds to an interface, if there are a number of sites where it can bind. referentially. The binding probability therefore depends on the number of bonds formed by the absorbing/adsorbing atoms or molecules with the surface. A very rugged interface has the atomic scale (high roughness) favors absorption while a smooth interface is rather unfavorable. The growth mechanism therefore varies depending on the structure and morphology of the interface.
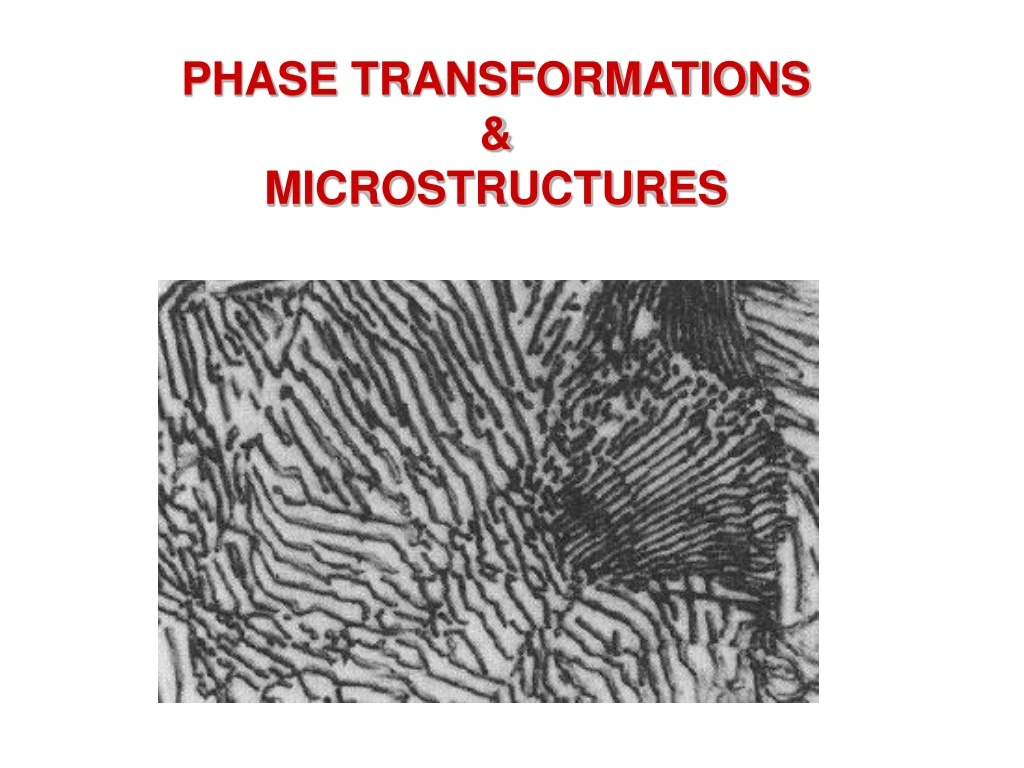
Growth at the scale of the microstructure In materials such as metals that crystallize quickly, adsorption phenomena that occur at the atomic scale are generally not limiting the rate/speed of the reaction, and they are only one part of the phase transformation. The other part of the process is constituted by the phenomena of structuring the material at a larger scale. These phenomena produce crystalline grain with diverse microstructures, whose dimensions vary, in general, from a fraction of mm to mm: dendrites (a) eutectic grains (b) platelet structures (c) formed during solid state phase transformations or during polymers crystallization.
Metallic alloy MICROSTRUCTURES Microstructures observed in metallic alloys: (a) dendrites, (b) lamellar eutectic, (c) dendrites and interdendritic eutectic, (d) precipitates formed in the solid state within the grains. It is important to note the various scales!
In metals, growth occurs with the same probability in all spatial directions (equiaxed growth) when the liquid metal is in the supercooled state during the transformation, which occurs frequently because supercooling is necessary for nucleation. During growth, the crystal releases latent heat, increasing its temperature. A negative temperature gradient ahead of the interface is established. This gradient allows the heat removal. If a protrusion forms, heat resulting from the processing will be evacuated more easily at the apex, which will then grow at a faster rate. So we can say that the solid-liquid interface in supercooled state is morphologically unstable. This reasoning allows us to explain the equiaxed dendritic growth from a spherical crystal nuclei. It is observed that the branches of dendrites grow following well defined crystallographic directions (e.g. snowflakes). Instabilité de Mullins-Sekerka
The growth rate increases strongly with the degree of supercooling until diffusion phenomena slow down the transformation. In general, we can say that all these microstructures become increasingly fine when the transformation rates increase. The acceleration of the transformation is only possible if the transfer of heat and of matter are fast, i.e., if the distances the matter has to travel are small. It is for this reason that the crystals are almost always formed with morphologies favorable to the heat and matter transfer phenomena, which explains the appearance of crystals in the form of needles, dendrites, or eutectic lamellae u ∙l2 = cte
Phase transformations kinetics – Avrami theory The phase transformation kinetics (liquid-solid and solid-solid) that proceeds by nucleation and growth mechanism generally obeys a transformation law proposed by Avrami, which provides an equation to calculate the degree of progress of the transformation phases in function of time (Avrami equation). n ranges form 1 to 4 depending on the type of transformation, and K is function of the nucleation processes, which are strongly temperature dependent. If K in function of temperature is known, the time needed to reach a given fraction of the converted phase (1%,50%,90% ...) is calculated at a given temperature.
Diagrammes TTT (ITD isothermal Transformation diagram) From the Avrami equation, phase transformation curves are calculated as a function of time and temperature for different values of the conversion rate (TTT diagrams). In general, two values of the conversion rates are selected to perform this calculation, which are still determinable experimentally and characterize the beginning (1% conversion) and the end of the reaction (99% conversion). Reading the TTT diagram is very simple. T1 <Te: After rapid cooling (quenching) of the material T> Te until the temperature T1 the material is maintained at a constant temperature. The transformation practically starts at time t = td. The transformation takes place gradually at a rate (df/dt) first growing rapidly because the speed of the reaction is proportional to volume changes (~ r3) and takes the form of an autocatalytic phenomenon. Then, it gradually slows down as the growing grains collide. Practically, it stops when the transformed volume is equal to 99% (t = tf). i i + f f
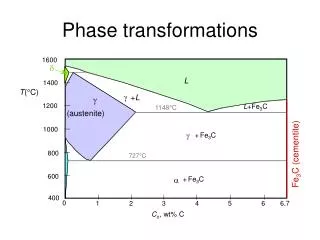
EXAMPLE A typical example of solid-solid transformation represented by the TTT diagram is the eutectoid transformation of steels containing 0.8 wt% C. From the Fe-g (austenite), Fe-a (ferrite) and iron carbides forms. In general, to perform this calculation two values of the conversion rate are selacted, which are still determinable experimentally and do characterize the beginning (1% conversion) and the end of the reaction (99% conversion).
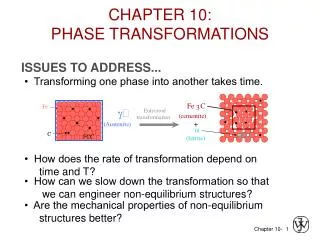
Examples of Iron-Iron Carbide Phase Transformations on the T-T-T Diagram Fe-Fe3C T-T-T Diagram, Adapted from Callister pg. 295, Fig. 10.6
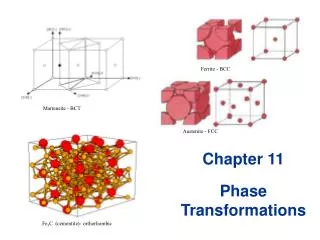
Martensite - I Représentation schématique de la transformation martensitique dans un acier au carbone. Les traitillés schématisent deux mailles cubiques à faces centrées. En blanc, on a représenté la maille tétragonale centrée (cubique centré déformé) de la martensite Fe (M). Pour éviter de compliquer Ie dessin, les deux atomes centraux des faces avant ne sont pas representés. Tous les sites representés par des cercles noirs sont occupés par des atomes de carbone.
Martensite - II For steels, the martensitic tansformation involves the sudden reorientation of C and Fe atoms from the fcc solid solution of g -Fe (austenite) to a body-centered tetragonal (bct) solid solution (martensite). In (a), the bct unit cell is shown relative to the fcc lattice by the h100iaxes. In (b), the bct unit cell is shown before (left) and after (right) the transformation. The open circles represent iron atoms. The solid circle represents an inter-stitially dissolved carbon atom.
Steel microstructures: (Austenite), Ferrite, Pearlite, Bainite, Martensite Austenite Pearlite forms below the eutectoid temperature. Pearlite is a mixture of cementite and ferrite, each colony being an interpenetrating bicrystal. Widmanstätten ferrite then begins to grow as a displacive transformation in which the interstitial atoms diffuse. At even larger undercoolings we get bainite, which is a displacive transformation like martensite, but unlike martensite does not remain supersaturated with carbon. The excess carbon rapidly precipitates as fine carbides between the plates of bainite (upper bainite) or within them (lower bainite).
Steel microstructures: Austenite, Ferrite, Pearlite, (Bainite), Martensite Microstructure typique d'un acier de construction (hypoeutectoide) apres refroidissement lent (-0,4% pds C) et d'un acier trempe, martensitique de meme composition (b).
Examples of Iron-Iron Carbide Phase Transformations on the T-T-T Diagram Coarse Pearlite Fine Pearlite Describe what transformations happen in: • Path 1 (Red line) b. Path 2 (Green line) c. Path 3 (Blue line) d. Path 4 (Orange line) Time-Temperature Paths on Isothermal Transformation Diagram
Solution • (Red) The specimen is cooled rapidly to 433 K and left for 20 minutes. The cooling rate is too rapid for pearlite to form at higher temperatures; therefore, the steel remains in the austenitic phase until the Ms temperature is passed, where martensite begins to form. Since 433 K is the temperature at which half of the austenite transforms to martensite, the direct quench converts 50% of the structure to martensite. Holding at 433 K forms only a small quantity of additional martensite, so the structure can be assumed to be half martensite and half retained austenite. b. (Green) The specimen is held at 523 K for 100 seconds, which is not long enough to form bainite. Therefore, the second quench from 523 K to room temperature develops a martensitic structure. c. (Blue) An isothermal hold at 573 K for 500 seconds produces a half-bainite and half-austenite structure. Cooling quickly would result in a final structure of martensite and bainite. d. (Orange) Austenite converts completely to fine pearlite after eight seconds at 873 K. This phase is stable and will not be changed on holding for 100,000 seconds at 873 K. The final structure, when cooled, is fine pearlite.
Spinodal Decomposition Variation de l'enthalpie libre molaire de mélange dans un système binaire à miscibilitépartielle en fonction de la composition. (b) Diagramme d'équilibre de phases. La courbe en trait plein délimite la zone de démixtion; la zone en grise représente la région spinelle. Tc est Ie point critique au-dessus duquel la solubilité dans la phase a est totale.
Transformation de phases par décomposition spinodale Dans les systemes binaires constitues par un mélange homogène de deux constituants A et B, il se produit constamment des fluctuations locales de concentration sous l'influence de l' agitation thermique. On peut montrer, en appliquant les lois de la thermodynamique, que l'amplitude moyenne des fluctuations dépend du signe de la dérive seconde de l' enthalpie libre par rapport à la concentration (fraction molaire XB). Si la dérivée seconde est positive, les fluctuations locales de concentration s'accompagnent d'une augmentation locale de I'enthalpie libre et elles ont tendance à s' amortir. Lorsque la dérivée seconde est négative toute variation locale de la concentration entraîne une diminution de l'enthalpie libre du système. Dans un tel système, les fluctuations de concentration ont tendance à s'amplifier dans tout le volume en entraînant progressivement la séparation du système binaire en deux phases. Une transformation de phases qui se produit de manière continue, sans la création initiale d'une interface et donc sans germination, est appelée décomposition spinodale.
Décomposition spinodale Du point de vue thermodynamique, le système ou intervient la décomposition spinodale est un système instable qui évolue spontanément vers un système stable sans passage d'une barrière thermodynamique. À noter que dans ce cas, la diffusion se fait dans Ie sens inverse a celui prévu par la loi de Fick car, ici, le gradient de concentration augmente. But is always goes in the direction of the gradient of the chemical potential µ
solidification hors-équilibre Schéma illustrant les variations de composition (C1, C2,...) d'une dendrite après solidification dans des conditions hors-équilibre.
Formation de microstructures dans un système binaire eutectique Formation de la microstructure dans les systemes binaires presentant un eutectique: diagramme d‘équilibre (a); courbe d'analyse thermique d'un alliage hypoeutectique C1, (b) et eutectique C2(c).
Formation de microstructures dans un système binaire eutectique Representation schématique de la formation d'une microstructure par precipitation en phase solide de particules pour obtenir un durcissement structural: (a) diagramme d‘équilibre partiel AI-Cu; (b) traitement thermique d'homogénéisation (recuit) à une temperature proche, mais inférieure à la temperature eutectique suivi d'une trempe et d'un recuit isotherme (revenu) à une temperature intermédiaire; (c) quatre microstructures après des temps de revenu différents en regard avec I’évolution de la dureté Hvdu matériau. C =concentration en % pds.