Download
1 / 23
230 likes | 248 Views
Methanol-Water Batch Distillation. September 20, 2005 UTC ENCH 435. Prepared by: Jason Hixson Don Scott Michael Hickey. Objective Equipment Power VLE Diagram Reboiler and Reflux composition. VLE Data for the column trays. Product Recovery. Conclusions

E N D
Methanol-Water Batch Distillation September 20, 2005 UTCENCH 435 Prepared by: Jason Hixson Don Scott Michael Hickey
Objective • Equipment • Power • VLE Diagram • Reboiler and Reflux composition. • VLE Data for the column trays. • Product Recovery. • Conclusions • Recommendations
Objective • Observe and analyze performance of batch distillation.
Power • Average heat loss Reboiler: • Average heat loss Column: • Average heat loss Condenser:
VLE Diagram Vapor, y Liquid,x
Reboiler Composition vs Time 75% Reflux 0% Reflux Initial xm: 23% 2500 W Initial Vm: 16.86 L
Reflux Composition vs Time 75% Reflux 0% Reflux Collected 1.69 L at 75% Reflux Collected 6.38 L at 0% Reflux
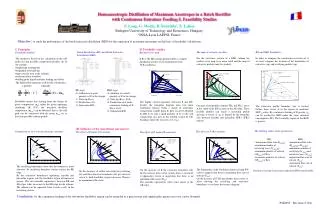
VLE Diagrams • All diagrams are for 75% reflux and 3200 W Setting.
Product Recovery • At 75% reflux and 3200 Watts the rate of recovery is approximately .5 gal/hour. • At 0% reflux and 2500 watts the rate of recovery is approximately 1.6 gal/hour.
Conclusions • At 75% reflux the purity of methane was a much higher quality. • If quality is more important then a high reflux percentage is needed. • If quantity and timeliness is more important then a low reflux is needed.