Download
1 / 38
380 likes | 492 Views
Durable Solutions Frameworks Understanding progress towards durable solutions. RECAP: DEFINING DURABLE SOLUTIONS: WHEN ARE THEY ACHIEVED?. A durable solution is achieved when displaced people : no longer have specific assistance and protection needs linked to their displacement

E N D
Durable Solutions Frameworks Understanding progress towards durable solutions
RECAP: DEFINING DURABLE SOLUTIONS: WHEN ARE THEY ACHIEVED? A durable solution is achieved when displaced people : no longer have specific assistance and protection needs linked to their displacement can exercise their rights without discrimination resulting from their displacement
3 DURABLE SOLUTIONS PROCESSES TO SUPPORT INTEGRATION The quality of the process leading to durable solutions is a key element necessary for ensuring its sustainability • Return / voluntary repatriation • INTEGRATION • Local Integration • Relocation / Resettlement
IASC FRAMEWORK ON DURABLE SOLUTIONS FOR IDPs – the key reference and the mostdeveloped • Endorsed by the UN Human Rights Council in 2010 • Establish 8 durable solutions criteria : a set of benchmarks to inform efforts to monitor progress toward durable solutions • Establish a set of 9 principles to guide durable solutions processes
IASC 8 CRITERIA Guidance and benchmarks to measure the level of achievement of durable solutions • Long-term safety and security • Adequate standard of living • Access to livelihoods and employment • Access to remedies and justice • Accessible mechanism for restoration of HLP • Personal and other documentation • Family reunification • Participation in public affairs Kenya’s 2012 act on IDPsincorporates the eightcriteria and adds the « full restoration and enjoyment of freedom of movement » Criteria overlap and should be adapted to the national context
Access for humanitarian and development initiatives and monitoring Government responsibility People’s rights, needs and interests are the primary concern Continued protection IDPs’ Information, consultation and participation IASC Support for host communities Respect for IDPs’ options Non-discrimination Prohibition of coercion
OPERATIONALIZING THE IASC FRAMEWORK • Goal: Collaboration and coordination of all relevant actors for a resilience based durable solutions planning • How? to develop common durable solutions tools to be used by all relevant actors based on the internationally recognized IASC criteria • What? joint planning (including data collection), monitoring and evaluation
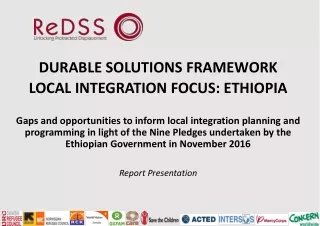
ReDSS Solutions Framework to measure progress towards integration INDICATORS SOLUTIONS FRAMEWORK • A practical, easy to analytical tool to assess to what extent durable solutions have been achieved in a particular context • Inclusive/ participatory process/ consensus building • Multi actors and sectors • Operationalization of IASC framework and its 8 criteria • 28 IASC indicators organized around physical, material and legal safety • Comparison to host communities • Traffic light system • Use of secondary data and reports – no new assessments conducted
MAIN CHALLENGES AND GAPS • Lack of common framework to plan for and monitor durable solutions • Poor performance monitoring of durable solutions programmes • Predominance of “soft” qualitative indicators • Lack of studies that establish baseline indicators to measure progress • Lack of economic indicators and data • Need for more development oriented tools and indicators
KEY CHALLENGES Most data sources, measurements and ratings of the indicators reflect a context of humanitarian service provision that is determined by displacement status rather than an equal legal status to the national population. This raises questions of the ‘quality’ of durable solutions available in contexts experiencing chronic crises, specifically in comparison to areas where local standards are already low. This can confuse discussions around minimum standards where the local / host population may be worse off than displaced hosted in their area. The lack of comparative data and analysis within and across displacement affected populations, and in comparison to local populations and national standard, is a key challenge. Access to quantitative data on some indicators is really challenging due to lack of standardisation of data management and lack of a common framework.
ReDSS FRAMEWORK: HOW TO USE IT? • As an analytical and programmatic tool • As a joint monitoring and evaluation tool to support coordination and to identify gaps • It provides common shared overall outcomes to be used as common analysis to inform planning
Green: DS can be achieved Orange: Benchmark for DS has not been met Red: Benchmark are far from being met White: Data missing REDSS FRAMEWORK : HOW DOES IT WORK? The objective is to improve and standardize the generation and availability of relevant data and analysis to better and more consistently operationalize joint response plans based on evidence in the search of durable solution in East Africa.
ReDSS Solutions Framework Guidance Manual • Outline on how to conduct a solutions analysis using the ReDSS Solutions Framework. The guidance manual can be used by anyone intending to undertake a solutions analysis using the ReDSS Solutions Framework. • a collaborative exercise involving a diverse range of stakeholders, including governmental actors and institutions, UN agencies, NGOs and academics. • The process should also foster the meaningful engagement of displacement-affected communities. An overview of the different sections of the Solutions Framework Guidance Manual
The solutions framework: a collaborative process through a consensus building approach
Solutions Framework Guidance Templates to conduct comprehensive solutions analysis
ReDSS Solutions programming guide- “Designing solutions-oriented programs” • An accompanying guide to the ReDSS Framework guidance manual on how to design programs and interventions that address the gaps identified in a solutions analysis. • A solution analysis is a crucial step in understanding the extent to which the environment is conducive to solutions and the extent to which progress has been made to towards solutions. • The solutions analysis will highlight areas/sectors where there are gaps and problems to address but it will not generate findings that will fully inform program design. Following on from a solutions analysis, agencies will need to design programs and interventions that address gaps and advance solutions- the programming guide provides support in this process. • The durable solutions programming guide is presented in 3 sections: • Core elements of solutions-oriented programs: outlines general requirements of solutions-oriented programs. • Incorporating a solutions-focus into assessments: outlinesthe key areas of enquiry that should be incorporated into sector-specific assessments. • Solutions outcomes, indicators and illustrative activities: presents “solutions log frames” for each of the 8 IASC criteria that appear in the ReDSS Solutions Framework. • The programming guide includes guidance on incorporating a solutions focus into assessments and developing solutions-oriented log frames.
Templates to inform solutions oriented programme development based on ReDSS Solutions framework Note: This guide & templates should be considered as a starting point- and more detailed guidance should be developed in collaboration with sector specialists
UN Somalia Area based Solutions analysis – Bay to better and more consistently operationalize (re)integration plans based on evidence Key findings and recommendations With the support of
UN Somalia CONTENT 1. Area based Solutions analysis – Bay region • Methodology • Key findings • Recommendations 2. Way forward and next steps
Objectives and methodology Review of existing assessments, data and programs to produce Solutions framework per district to inform multi-sectorial rights and needs based plans/ programs. First ones in October/November and second one in February/ March Participatory process and consensus building approach – consultations with NGOs, clusters, humanitarian and development donors, UN, governments, etc Validations workshops to discuss and review the indicators rating, key findings and preliminary recommendations- collectivelyagree on gaps and priorities building on existing humanitarian and development programmes to address the needs of displacement affected communities Developing Area Based Joint Solutions Analysis in Somalia to inform safe and dignified (re)integration modalities is paramount to address limited absorption capacity, limited access to basic services, shelters and livelihoods opportunities, prevailing protection concerns, and persistent security, safety and access issues
SOLUTIONS FRAMEWORK LOCAL INTEGRATION - RETURNEE/IDP FOCUS Bay – Somalia2016/17Analysis of Data: All population Safety and Security Protection Social Cohesion Percentage of IDPs/returnees feeling safe in their current place of residence compared to local population Percentage of IDPs/returnees who have suffered violent crimes or experienced safety incidents, including Sexual Gender based Violence in the last 6 months compared to resident population Percentage of IDPs/returnees who do not face more discriminatory or arbitrary restriction of their freedom of movement based on their displacement or minority status compared to resident population Percentage of IDPs/returnees who do not face any form of stigmatization (verbal violence, insults, exclusion, etc.) in their current place of residence, compared to local population Percentage of IDPs/returnees feeling they are accepted in the community where they live compared to resident population Percentage of IDPs/returnees who have adequate access to police and judiciary, when needed, compared to the resident population PHYSICAL SAFETY Adequate Standard of Living (Access to basic and social services) Percentage of IDPs/returnees with food consumption comparable to local population and as per international/national standards Prevalence of GAM/SAM among IDPs/returnees compared to resident population and as per national/international standards Percentage of IDPs/returnees with adequate access to potable water, sanitation and hygiene compared to local population and above international/national standard Percentage of IDP/returnee children with adequate access to formal education compared to resident population or national average as appropriate Percentage of IDPs/returnees with adequate access to health care compared to resident population or national average as appropriate Percentage of IDPs/returnees who have adequate access to safety net interventions or receive remittances from abroad compared to local residents with comparable needs Access to Livelihoods (Job creation and income generation) MATERIAL SAFETY Percentage of IDPs/returnees who faces legal or administrative obstacles to employment or economic activity compared to resident population(Administrative obstacles exist) Unemployment among refugees compared to the resident population, the situation before displacement or the national average, as appropriate Poverty levels among IDPS/returnees compared to the resident population, the situation before displacement or the national average, as appropriate Percentage of IDPs/returnees who have access to sustainable employment conditions compared to local residents Participation in public affairs Housing, Land & Property Percentage of IDPs/returnees who have secured right to Housing, Land and Property (with documents to prove ownership/tenancy) compared to resident population Percentage of IDPs/returnees with adequate housing (not overcrowded housing/shelter and/or precarious structure and/or at risk of sudden eviction) in comparison to the resident population Existence of effective and accessible mechanisms to ensure access to land and/or secure tenure Percentage of IDPs/returnees with lost HLP who have had their claims resolved, compared to the resident population Access to Effective Remedies & Justice Participation in public affairs Percentage of IDPs/returnees who accessed formal or informal/traditional justice mechanisms last time they needed it, compared to local population Percentage of IDPs/returnees involved in public decision making processes, or local reconciliation/confidence-building initiatives (e.g. local peace committees, public debates, fora, cross-community activities and others) compared to resident population Percentage of IDPs/returnees participating in community or social organizations (youth / women / environmental / sports groups and others) compared to the resident population Percentage of IDPs/returnees who consider that the violations suffered have been effectively remedied and a sense of justice restored, compared to local population Existence of accessible mechanisms that have the legal mandate and actual capacity to provide IDPs/returnees with effective remedies for violations suffered, including violations committed by non-state actors IDPs/returnees face no legal or administrative obstacles that prevent them from voting, being elected or working in public service compared with resident population LEGAL SAFETY Access to Documentation All indicators refer to the attainment of benchmarks for a refugee / returnee in comparison to the host community The indicator is well on the way to being achieved Some obstacles exist and the indicator has not been fully met The indicator is far from met Data unavailable Incomplete data exists Percentage of IDPs/returnees without birth certificates, national ID cards or other personal documents relevant to the local context compared to resident population or national average, as appropriate Existence and effective accessibility of mechanisms to obtain/replace documents for IDPs/returnees bearing in mind the local context Family Reunification The number of unaccompanied and separated IDPs/returnee children for whom a best interest determination is needed but has not been conducted Accessible and efficient mechanisms have been put in place to reunite IDP/returnee separated family members The number of IDP/returnee children or other dependent persons who have not yet been reunited with their families relative to total displaced population size The Regional Durable Solutions Secretariat (ReDSS) operationalized the IASC Framework for Durable Solutions for IDPs to develop the ReDSS Solutions framework for displacement affected communities. It comprises the 8 IASC criteria using 31 IASC indicators organized around physical, material and legal safety to measure durable solutions achievements in a particular context. The framework analysis serves as an evidence base to enable relevant stakeholders to work more effectively and consistently in the search and realization of durable solutions. This info graphic offers a snapshot in time to assess to what extent local integration for returnees and IDPs in Somalia have been achieved.
SOLUTIONS FRAMEWORK LOCAL INTEGRATION - RETURNEE/IDP FOCUS Bay – Somalia2016/17Analysis of Data: IDPs Protection Safety and Security Social Cohesion Percentage of IDPs/returnees who have suffered violent crimes or experienced safety incidents, including Sexual Gender based Violence in the last 6 months compared to resident population Percentage of IDPs/returnees who do not face more discriminatory or arbitrary restriction of their freedom of movement based on their displacement or minority status compared to resident population Percentage of IDPs/returnees feeling safe in their current place of residence compared to local population Percentage of IDPs/returnees who do not face any form of stigmatization (verbal violence, insults, exclusion, etc.) in their current place of residence, compared to local population Percentage of IDPs/returnees feeling they are accepted in the community where they live compared to resident population Percentage of IDPs/returnees who have adequate access to police and judiciary, when needed, compared to the resident population PHYSICAL SAFETY Adequate Standard of Living (Access to basic and social services) Percentage of IDPs/returnees with food consumption comparable to local population and as per international/national standards Percentage of IDPs/returnees with adequate access to potable water, sanitation and hygiene compared to local population and above international/national standard Percentage of IDP/returnee children with adequate access to formal education compared to resident population or national average as appropriate Prevalence of GAM/SAM among IDPs/returnees compared to resident population and as per national/international standards Percentage of IDPs/returnees with adequate access to health care compared to resident population or national average as appropriate Percentage of IDPs/returnees who have adequate access to safety net interventions or receive remittances from abroad compared to local residents with comparable needs Access to Livelihoods (Job creation and income generation) MATERIAL SAFETY Percentage of IDPs/returnees who faces legal or administrative obstacles to employment or economic activity compared to resident population(Administrative obstacles exist) Unemployment among refugees compared to the resident population, the situation before displacement or the national average, as appropriate Poverty levels among IDPS/returnees compared to the resident population, the situation before displacement or the national average, as appropriate Percentage of IDPs/returnees who have access to sustainable employment conditions compared to local residents Participation in public affairs Housing, Land & Property Percentage of IDPs/returnees with adequate housing (not overcrowded housing/shelter and/or precarious structure and/or at risk of sudden eviction) in comparison to the resident population Percentage of IDPs/returnees who have secured right to Housing, Land and Property (with documents to prove ownership/tenancy) compared to resident population Existence of effective and accessible mechanisms to ensure access to land and/or secure tenure Percentage of IDPs/returnees with lost HLP who have had their claims resolved, compared to the resident population Access to Effective Remedies & Justice Participation in public affairs Percentage of IDPs/returnees who accessed formal or informal/traditional justice mechanisms last time they needed it, compared to local population Percentage of IDPs/returnees involved in public decision making processes, or local reconciliation/confidence-building initiatives (e.g. local peace committees, public debates, fora, cross-community activities and others) compared to resident population Percentage of IDPs/returnees participating in community or social organizations (youth / women / environmental / sports groups and others) compared to the resident population Percentage of IDPs/returnees who consider that the violations suffered have been effectively remedied and a sense of justice restored, compared to local population Existence of accessible mechanisms that have the legal mandate and actual capacity to provide IDPs/returnees with effective remedies for violations suffered, including violations committed by non-state actors IDPs/returnees face no legal or administrative obstacles that prevent them from voting, being elected or working in public service compared with resident population LEGAL SAFETY Access to Documentation All indicators refer to the attainment of benchmarks for a refugee / returnee in comparison to the host community The indicator is well on the way to being achieved Some obstacles exist and the indicator has not been fully met The indicator is far from met Data unavailable Incomplete data exists Percentage of IDPs/returnees without birth certificates, national ID cards or other personal documents relevant to the local context compared to resident population or national average, as appropriate Existence and effective accessibility of mechanisms to obtain/replace documents for IDPs/returnees bearing in mind the local context Family Reunification The number of unaccompanied and separated IDPs/returnee children for whom a best interest determination is needed but has not been conducted Accessible and efficient mechanisms have been put in place to reunite IDP/returnee separated family members The number of IDP/returnee children or other dependent persons who have not yet been reunited with their families relative to total displaced population size The Regional Durable Solutions Secretariat (ReDSS) operationalized the IASC Framework for Durable Solutions for IDPs to develop the ReDSS Solutions framework for displacement affected communities. It comprises the 8 IASC criteria using 31 IASC indicators organized around physical, material and legal safety to measure durable solutions achievements in a particular context. The framework analysis serves as an evidence base to enable relevant stakeholders to work more effectively and consistently in the search and realization of durable solutions. This info graphic offers a snapshot in time to assess to what extent local integration for returnees and IDPs in Somalia have been achieved.
SOLUTIONS FRAMEWORK LOCAL INTEGRATION - RETURNEE/IDP FOCUS Bay – Somalia2016/17 Analysis of Data: Returnees Protection Safety and Security Social Cohesion Percentage of IDPs/returnees who have suffered violent crimes or experienced safety incidents, including Sexual Gender based Violence in the last 6 months compared to resident population Percentage of IDPs/returnees who do not face more discriminatory or arbitrary restriction of their freedom of movement based on their displacement or minority status compared to resident population Percentage of IDPs/returnees feeling safe in their current place of residence compared to local population Percentage of IDPs/returnees who do not face any form of stigmatization (verbal violence, insults, exclusion, etc.) in their current place of residence, compared to local population Percentage of IDPs/returnees feeling they are accepted in the community where they live compared to resident population Percentage of IDPs/returnees who have adequate access to police and judiciary, when needed, compared to the resident population PHYSICAL SAFETY Adequate Standard of Living (Access to basic and social services) Percentage of IDPs/returnees with food consumption comparable to local population and as per international/national standards Percentage of IDPs/returnees with adequate access to potable water, sanitation and hygiene compared to local population and above international/national standard Percentage of IDP/returnee children with adequate access to formal education compared to resident population or national average as appropriate Prevalence of GAM/SAM among IDPs/returnees compared to resident population and as per national/international standards Percentage of IDPs/returnees with adequate access to health care compared to resident population or national average as appropriate Percentage of IDPs/returnees who have adequate access to safety net interventions or receive remittances from abroad compared to local residents with comparable needs Access to Livelihoods (Job creation and income generation) MATERIAL SAFETY Percentage of IDPs/returnees who faces legal or administrative obstacles to employment or economic activity compared to resident population(Administrative obstacles exist) Unemployment among returnees compared to the resident population, the situation before displacement or the national average, as appropriate Poverty levels among IDPS/returnees compared to the resident population, the situation before displacement or the national average, as appropriate Percentage of IDPs/returnees who have access to sustainable employment conditions compared to local residents Participation in public affairs Housing, Land & Property Percentage of IDPs/returnees with adequate housing (not overcrowded housing/shelter and/or precarious structure and/or at risk of sudden eviction) in comparison to the resident population Percentage of IDPs/returnees who have secured right to Housing, Land and Property (with documents to prove ownership/tenancy) compared to resident population Existence of effective and accessible mechanisms to ensure access to land and/or secure tenure Percentage of IDPs/returnees with lost HLP who have had their claims resolved, compared to the resident population Access to Effective Remedies & Justice Participation in public affairs Percentage of IDPs/returnees who accessed formal or informal/traditional justice mechanisms last time they needed it, compared to local population Percentage of IDPs/returnees involved in public decision making processes, or local reconciliation/confidence-building initiatives (e.g. local peace committees, public debates, fora, cross-community activities and others) compared to resident population Percentage of IDPs/returnees participating in community or social organizations (youth / women / environmental / sports groups and others) compared to the resident population Percentage of IDPs/returnees who consider that the violations suffered have been effectively remedied and a sense of justice restored, compared to local population Existence of accessible mechanisms that have the legal mandate and actual capacity to provide IDPs/returnees with effective remedies for violations suffered, including violations committed by non-state actors IDPs/returnees face no legal or administrative obstacles that prevent them from voting, being elected or working in public service compared with resident population LEGAL SAFETY Access to Documentation All indicators refer to the attainment of benchmarks for a refugee / returnee in comparison to the host community The indicator is well on the way to being achieved Some obstacles exist and the indicator has not been fully met The indicator is far from met Data unavailable Incomplete data exists Percentage of IDPs/returnees without birth certificates, national ID cards or other personal documents relevant to the local context compared to resident population or national average, as appropriate Existence and effective accessibility of mechanisms to obtain/replace documents for IDPs/returnees bearing in mind the local context Family Reunification The number of unaccompanied and separated IDPs/returnee children for whom a best interest determination is needed but has not been conducted Accessible and efficient mechanisms have been put in place to reunite IDP/returnee separated family members The number of IDP/returnee children or other dependent persons who have not yet been reunited with their families relative to total displaced population size The Regional Durable Solutions Secretariat (ReDSS) operationalized the IASC Framework for Durable Solutions for IDPs to develop the ReDSS Solutions framework for displacement affected communities. It comprises the 8 IASC criteria using 31 IASC indicators organized around physical, material and legal safety to measure durable solutions achievements in a particular context. The framework analysis serves as an evidence base to enable relevant stakeholders to work more effectively and consistently in the search and realization of durable solutions. This info graphic offers a snapshot in time to assess to what extent local integration for returnees and IDPs in Somalia have been achieved.
SOLUTIONS FRAMEWORK LOCAL INTEGRATION - RETURNEE/IDP FOCUS Bay – Somalia2016/17 Overall Rating Protection Safety and Security Social Cohesion Percentage of IDPs/returnees who have suffered violent crimes or experienced safety incidents, including Sexual Gender based Violence in the last 6 months compared to resident population Percentage of IDPs/returnees who do not face more discriminatory or arbitrary restriction of their freedom of movement based on their displacement or minority status compared to resident population Percentage of IDPs/returnees feeling safe in their current place of residence compared to local population Percentage of IDPs/returnees who do not face any form of stigmatization (verbal violence, insults, exclusion, etc.) in their current place of residence, compared to local population Percentage of IDPs/returnees feeling they are accepted in the community where they live compared to resident population Percentage of IDPs/returnees who have adequate access to police and judiciary, when needed, compared to the resident population PHYSICAL SAFETY Adequate Standard of Living (Access to basic and social services) Percentage of IDPs/returnees with food consumption comparable to local population and as per international/national standards Percentage of IDPs/returnees with adequate access to potable water, sanitation and hygiene compared to local population and as per international/national standard Percentage of IDP/returnee children with adequate access to formal education compared to resident population or national average as appropriate Prevalence of GAM/SAM among IDPs/returnees compared to resident population and as per national/international standards Percentage of IDPs/returnees with adequate access to health care compared to resident population or national average as appropriate Percentage of IDPs/returnees who have adequate access to safety net interventions or receive remittances from abroad compared to local residents with comparable needs Access to Livelihoods (Job creation and income generation) MATERIAL SAFETY Unemployment among returnees compared to the resident population, the situation before displacement or the national average, as appropriate Percentage of IDPs/returnees who have access to sustainable employment conditions compared to local residents Poverty levels among IDPS/returnees compared to the resident population, the situation before displacement or the national average, as appropriate Percentage of IDPs/returnees who faces legal or administrative obstacles to employment or economic activity compared to resident population Participation in public affairs Housing, Land & Property Percentage of IDPs/returnees who have secured right to Housing, Land and Property (with documents to prove ownership/tenancy) compared to resident population Percentage of IDPs/returnees with adequate housing (not overcrowded housing/shelter and/or precarious structure and/or at risk of sudden eviction) in comparison to the resident population Existence of effective and accessible mechanisms to ensure access to land and/or secure tenure Percentage of IDPs/returnees with lost HLP who have had their claims resolved, compared to the resident population Access to Effective Remedies & Justice Participation in public affairs Percentage of IDPs/returnees who accessed formal or informal/traditional justice mechanisms last time they needed it, compared to local population Percentage of IDPs/returnees involved in public decision making processes, or local reconciliation/confidence-building initiatives (e.g. local peace committees, public debates, fora, cross-community activities and others) compared to resident population Percentage of IDPs/returnees participating in community or social organizations (youth / women / environmental / sports groups and others) compared to the resident population Percentage of IDPs/returnees who consider that the violations suffered have been effectively remedied and a sense of justice restored, compared to local population Existence of accessible mechanisms that have the legal mandate and actual capacity to provide IDPs/returnees with effective remedies for violations suffered, including violations committed by non-state actors IDPs/returnees face no legal or administrative obstacles that prevent them from voting, being elected or working in public service compared with resident population LEGAL SAFETY Access to Documentation All indicators refer to the attainment of benchmarks for a refugee / returnee in comparison to the host community The indicator is well on the way to being achieved Some obstacles exist and the indicator has not been fully met The indicator is far from met Data unavailable Incomplete data exists Percentage of IDPs/returnees without birth certificates, national ID cards or other personal documents relevant to the local context compared to resident population or national average, as appropriate Existence and effective accessibility of mechanisms to obtain/replace documents for IDPs/returnees bearing in mind the local context Family Reunification The number of unaccompanied and separated IDPs/returnee children for whom a best interest determination is needed but has not been conducted Accessible and efficient mechanisms have been put in place to reunite IDP/returnee separated family members The number of IDP/returnee children or other dependent persons who have not yet been reunited with their families relative to total displaced population size The Regional Durable Solutions Secretariat (ReDSS) operationalized the IASC Framework for Durable Solutions for IDPs to develop the ReDSS Solutions framework for displacement affected communities. It comprises the 8 IASC criteria using 31 IASC indicators organized around physical, material and legal safety to measure durable solutions achievements in a particular context. The framework analysis serves as an evidence base to enable relevant stakeholders to work more effectively and consistently in the search and realization of durable solutions. This info graphic offers a snapshot in time to assess to what extent local integration for returnees and IDPs in Somalia have been achieved.
SOLUTIONS FRAMEWORK LOCAL INTEGRATION - RETURNEE/IDP FOCUS Bay – Somalia2016/17 Projections for 2017 Protection Safety and Security Social Cohesion Percentage of IDPs/returnees who have suffered violent crimes or experienced safety incidents, including Sexual Gender based Violence in the last 6 months compared to resident population Percentage of IDPs/returnees who do not face any form of stigmatization (verbal violence, insults, exclusion, etc.) in their current place of residence, compared to local population Percentage of IDPs/returnees feeling they are accepted in the community where they live compared to resident population Percentage of IDPs/returnees feeling safe in their current place of residence compared to local population Percentage of IDPs/returnees who do not face more discriminatory or arbitrary restriction of their freedom of movement based on their displacement or minority status compared to resident population Percentage of IDPs/returnees who have adequate access to police and judiciary, when needed, compared to the resident population PHYSICAL SAFETY Adequate Standard of Living (Access to basic and social services) Percentage of IDPs/returnees with food consumption comparable to local population and as per international/national standards Prevalence of GAM/SAM among IDPs/returnees compared to resident population and as per national/international standards Percentage of IDPs/returnees with adequate access to potable water, sanitation and hygiene compared to local population and above international/national standard Percentage of IDP/returnee children with adequate access to formal education compared to resident population or national average as appropriate Percentage of IDPs/returnees with adequate access to health care compared to resident population or national average as appropriate Percentage of IDPs/returnees who have adequate access to safety net interventions or receive remittances from abroad compared to local residents with comparable needs Access to Livelihoods (Job creation and income generation) MATERIAL SAFETY Percentage of IDPs/returnees who faces legal or administrative obstacles to employment or economic activity compared to resident population Unemployment among returnees compared to the resident population, the situation before displacement or the national average, as appropriate Percentage of IDPs/returnees who have access to sustainable employment conditions compared to local residents Poverty levels among IDPS/returnees compared to the resident population, the situation before displacement or the national average, as appropriate Housing, Land & Property Percentage of IDPs/returnees who have secured right to Housing, Land and Property (with documents to prove ownership/tenancy) compared to resident population Percentage of IDPs/returnees with adequate housing (not overcrowded housing/shelter and/or precarious structure and/or at risk of sudden eviction) in comparison to the resident population Existence of effective and accessible mechanisms to ensure access to land and/or secure tenure Percentage of IDPs/returnees with lost HLP who have had their claims resolved, compared to the resident population Access to Effective Remedies & Justice Participation in public affairs Percentage of IDPs/returnees who accessed formal or informal/traditional justice mechanisms last time they needed it, compared to local population Percentage of IDPs/returnees involved in public decision making processes, or local reconciliation/confidence-building initiatives (e.g. local peace committees, public debates, fora, cross-community activities and others) compared to resident population Percentage of IDPs/returnees participating in community or social organizations (youth / women / environmental / sports groups and others) compared to the resident population Percentage of IDPs/returnees who consider that the violations suffered have been effectively remedied and a sense of justice restored, compared to local population Existence of accessible mechanisms that have the legal mandate and actual capacity to provide IDPs/returnees with effective remedies for violations suffered, including violations committed by non-state actors IDPs/returnees face no legal or administrative obstacles that prevent them from voting, being elected or working in public service compared with resident population LEGAL SAFETY Access to Documentation All indicators refer to the attainment of benchmarks for a refugee / returnee in comparison to the host community The indicator is well on the way to being achieved Some obstacles exist and the indicator has not been fully met The indicator is far from met Data unavailable Incomplete data exists Percentage of IDPs/returnees without birth certificates, national ID cards or other personal documents relevant to the local context compared to resident population or national average, as appropriate Existence and effective accessibility of mechanisms to obtain/replace documents for IDPs/returnees bearing in mind the local context Family Reunification The number of unaccompanied and separated IDPs/returnee children for whom a best interest determination is needed but has not been conducted The number of IDP/returnee children or other dependent persons who have not yet been reunited with their families relative to total displaced population size Accessible and efficient mechanisms have been put in place to reunite IDP/returnee separated family members The Regional Durable Solutions Secretariat (ReDSS) operationalized the IASC Framework for Durable Solutions for IDPs to develop the ReDSS Solutions framework for displacement affected communities. It comprises the 8 IASC criteria using 31 IASC indicators organized around physical, material and legal safety to measure durable solutions achievements in a particular context. The framework analysis serves as an evidence base to enable relevant stakeholders to work more effectively and consistently in the search and realization of durable solutions. This info graphic offers a snapshot in time to assess to what extent local integration for returnees and IDPs in Somalia have been achieved.
UN Somalia Recommendations to: • prioritize ‘immediate’ (re)integration needs for displacement affected communities • inform medium/long term sectorial priorities of development programing complementing humanitarian interventions • Identify synergies between emergency response and resilience/development/governance interventions • Core elements • Adopting a joint integrated and multi sectorial programing • Adopting a stronger focus on ‘early solutions’ • Prioritizing sectors and areas of interventions through integrated and multi sectorial programing:
A. Core elements to inform Solutions planning and programing Creating durable solutions requires a multi- stakeholder and sectoral, rights and needs based programming approach – build on existing The process must be viewed as a collective action rather than mandate driven based on an inclusive, participatory and consensus building approach The FGS, regional administrations and local authorities have the primary responsibility and they need to be supported to be able to play a leadership and coordinating role Developing area based Solutions analysis (localization of aid) is paramount due to limited absorption capacity, prevailing protection concerns, and persistent security and access issues. Community engagement is critical to inform reintegration analysis and programing to make solutions lasting, locally relevant and supportive of social cohesion and to adopt a ‘displacement affected communities’ approach- inclusive of returnees, IDPs and host communities Involve development actors from the start to inform medium to long term sectorial priorities complementing humanitarian interventions
UN Somalia B. Adopting a joint integrated and multi sectorial programing (1/2)(relevant to Bay - from Lower Juba report – on-going or planned) • Donors and implementing partners should adopt a displacement focus and a common Durable Solutions framework to monitor progress and challenges. More specifically, • Implementing partners should adopt a displacement focus in data collection; • Surveys should be longitudinal and include representative samples of IDPs and returnees, as well as urban and rural populations; • Data on post-return monitoring should be standardized (in line with national household surveys) and made available.
UN Somalia B. Adopting a joint integrated and multi sectorial programing (2/2)(relevant to Bay - from Lower Juba report – on going or planned) • Humanitarian and development actors should adopt joint analyses and joint area-based planning under the lead of the government, to ensure mutual accountability and sustainability and to enhance the impact of interventions. More specifically, • Donors and their implementing partners should invest in strengthening national and local capacity to understand displacement and sustain solutions; • Humanitarian, development and government actors should use joint analysis under a common Durable Solutions Framework to achieve common understanding and coherent outcomes delivery; • Humanitarian and development actors should develop Joint Outcomes to support joint area-based planning under the leadership of the government.
UN Somalia C. Adopting a stronger focus on ‘early solutions’ from the onset of the emergency response (specific for Baidoa) • Improved coordination between emergency and recovery/resilience/governance interventions. More specifically: • Joint targeting and use of multi-purpose cash transfers and vouchers: Emergency and recovery/resilience/governance interventions should target same areas with populations at risk of displacement; Resilience interventions to phase in with more targeted and behavior conditioned cash transfers as soon as the intensity of the crises recedes and emergency interventions start phasing out • Sharing of data between emergency and recovery/resilience/governance interventions: Data and movements and displacement should provide detailed information also about the places of origin and not just place of destination
UN Somalia D. Prioritizing sectors and areas of interventions through integrated and multi sectorial programing(1/2) • Donors and implementing partners should seek a social compact with Somali business community, so that they can • increase investment on provision of basic services, food assistance, and shelter • without a proportional reduction in investments and efforts on livelihoods, income generation and job creation programmes Vendors and contractors that work in partnership with aid agencies could raise funds for projects on WASH, education and health, or provide financial support to vocational training IDPs and hire the most successful trainees as employees
UN Somalia D. Prioritizing sectors and areas of interventions through integrated and multi sectorial programing(2/2) Based on suggestions from consultation workshops in Baidoa and Mogadishu, the following is recommended: • Physical Safety: • Rule of law and security programmes should find a balance between provision of security services (e.g. training of police and establishment of police stations) and boosting capacity of IDPS and marginalized populations to access these services (e.g. awareness campaigns for IDPs on how to refer cases to police services, police-community dialogue). • Safety programmes should also prioritize interventions that can reduce common criminality or make people less vulnerable to violence (e.g. street lights, safe public places; “dignity kits” etc.)
UN Somalia • Material Safety: • Programmes that create access to sustainable livelihoods opportunities should be prioritized: vocational training for IPDs and returnees should be based on market needs; there is need to have closer partnerships between training institutions and business associations; trainings should have a placement scheme for successfully trainees; start-up grants should be provided only to beneficiaries that are genuinely interested to become entrepreneurs; creation of cooperatives and co-owned companies should be preferred as they are usually more viable than sole-entrepreneurship; • Programme that improve sustainable access to basic social services should be prioritized: there is need to put in place cost-recovery mechanisms, mobilize contributions from communities and diaspora and funding from the government to ensure the continuous running of schools and health centres;
UN Somalia • Material Safety (continued) • Programmes working on Housing, Land and Property (HLP) should address both the legal aspects of HLP (e.g. claiming lost lands, securing tenure etc), and the economic aspects of HLP (e.g limited disposable income of IDPs to access housing in urban context through increased provision of vouchers or financial support) as two interrelated but still different issues; • Legal safety: • Similarly to physical safety, Rule of law and security programmes should find a balance between provision of justice services (e.g. training of judges and establishment of courts) and boosting capacity of IDPS and marginalized populations to access these services (e.g. awareness campaigns for IDPs and marginalized populations on who to use the various legal systems (formal, Sharia and Xeer; provision of legal counseling)
UN Somalia Next steps and way forward 1. Need for Area based Action Plans for Bay region - DSRSG/HC/RC together with South West state government 2. Update of the study with new data - ReDSS
ReDSS SOLUTIONS DASHBOARD Online visualization of ReDSS solutions indicators to inform durable solution programing based on indicator rating and analysis To access the solutions dashboard: http://redss.onalabs.org/ and the password is redss. For the help guide/ tutorial: http://redss-helpsite.onalabs.org/
Map View: Selection Panel Works the same as Framework view, except you also have to select the indicator you want to view