Download

1 / 45
450 likes | 581 Views
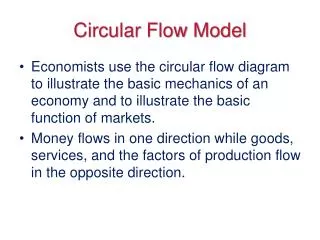
The Circular Flow Model and the Market System. Circular Flow.

E N D
Circular Flow • You decide to by a car so you go to the dealer and exchange money for the car. The dealer has rented land and buildings while also hiring workers to produce the cars. The employees earn income for their labor and use that income to buy food from the grocery store. This transaction generates revenue for the grocery store, which also hires workers and pays them income that they then use to purchase goods and services. Your expenditure for the car is part of a circular flow.
Circular Flow continued • Now, complicating the prior story is the fact that some car's are made in Japan and then shipped to the U.S. Your purchase also creates revenue for the manufacturer in Japan, who pays Japanese workers to produce car's. Also, when you buy a car, you must pay a tax to the government, which uses tax revenues to pay for police protection, national defense, and other services
The Market System • Consumer Sovereignty- • Consumers exercise so much power b/c the name of the game for businesses is profit and the only way they achieve this is by satisfying consumer wants
Consumer Power • In the 1950’s and 1960’s people were eating out more then ever. They wanted more restaurants and fast-food outlets. • As a result McDonalds, Wendy’s, White Castle, Pizza Hut, Godfathers Pizza, Big Boy’s and other fast-food outlets flourished. • By the 1970’s the average number of meals per person eaten out daily exceeded one (excluding meals prepared at home and eaten elsewhere)
Profit and Allocation of Resources • When a good or service has profit potential someone with entrepreneurial ability will put together the resources needed to produce that gizmo • Hopefully they sell their gizmos for more then they paid for land, labor, capital. (that's profit) • If the entrepreneur loses money they may opt to stop producing that good • The resources then used in the losing operation are available for an activity of possible higher value (see book pages 74 and 75)
The Flow of Resources • Resources naturally flow from an activity where they have a relatively low value to and an activity with a higher value (ex, rubber sole shoes go out of style and the rubber is now used to produce a new popular brand of tires) • Adam Smith described this phenomenon in his 1776 treatise (essay) “The Wealth of Nations,” saying it was as if an invisible hand reached out and guided resources to their most valued use (more on Adam Smith page 77)
The Flow of Resources • Firms produce goods and services and use the resources that enable them to generate the highest profits • Firms often mimic other firms who are generating a higher profit • If a firm cannot compete with others firms in the same industry it will go out of business and possibly move to another area line of business
McDonalds Dollar Menu • Many other fast food chains copied McDonalds
The Flow of Resources • Because goods are produced in the least costly manner, consumers will more often pay a low price for the goods that they desire
The Determination of Income • Consumers dictate what is produced and the search for profit defines how goods and services are produced. • Now, for whom are goods and services produced? • Income is obtained by selling the services of resources
The Determination of Income • Labor= • land= • Capital= • Entrepreneurs= • This shows us that buyers and sellers of goods and services and resource owners are linked in the economy
Linkage of Sectors • Household sector= • Business sector= • International sector= • * These three sectors constitute the ______________ of our economy*
Households • A unit of housing may be a house, an apartment, even a single living room as long as it constitutes separate living quarters • Can consist of family members or college students sharing an apartment • Householder-
Households • There are more than 100 million households in the U.S. • The largest number of householders fall between the ages of 35 and 44 • Householders between the ages of 45 and 54 have the largest median income (roughly $ 60,000) • Median is the middle value- half of the households make more than $60,000 and half make less
Size Distribution of Households • In the U.S. the average number of people per household is 2.2 • Worldwide, average household size in high-income countries (those with an average per capita income over $9,000 per year) is near that of the U.S; that of middle and low income countries is more than twice as large • Per capita income-
Household Spending • Household spending is called • Spending in the household sector is the largest component of spending in the economy (roughly $6.7 trillion in 2000) • We consume housing, transportation, food, entertainment, and other goods and services
Business Firms • May be conducted at more than one location • The terms company, enterprise, and business are used interchangeably with firm
Forms of Business Organizations • Sole Proprietorship- • Partnership-
Forms of Business Organizations • Corporation- • Multinational Business-
Big Business • Very important in the U.S. • There are many small firms, but large firms and corporations account for the greatest share of business revenue • Many more sole proprietorships than corporations, but corporations make 15x’s the revenue • (see handout and book statistics page 81) • Big Business is a global phenomenon
Worlds Ten Largest Public Corporations (2008) • 1) Royal Dutch Shell (Netherlands) • 2) Exxon Mobil (U.S.) • 3) Wal-Mart Stores (U.S.) • 4) BP= British Petroleum (Britain) • 5) Chevron (U.S.) • 6) Total (France) • 7) Conoco Phillips (U.S.) • 8) ING Group (Netherlands) • 9) Sinopec (China) • 10) Toyota Motor (Japan) • http://money.cnn.com/magazines/fortune/global500/2009/snapshots/6388.html
Business Spending • Investment- • Economics definition of investment is different then the everyday definition (financial transaction such a buying bonds or stocks) • Investment spending in 2002 reached $1,588 billion (equal to ¼ of consumption or household spending)
International Sector • Foreign buyers and sellers have a significant impact on economic conditions in the U.S. (example, foreign exchange rates can affect the demand for U.S. goods) • Current Exchange Rates • http://www.x-rates.com/
Types of Countries • Industrial and Developing • Developing countries greatly outnumber industrial countries • World Bank- • The World Bank groups countries according to their per capita income (income per person)
Types of Countries (cont.) • Low income economies (per capita income less than $755.00) heavily concentrated in Asia and Africa • Middle income economies (per capita income of $756.00 to $9,265.00) • High income economies such as oil exporters or market industrial economies (per capita income $9,266.00 or higher) • Some countries are not members of the world bank so they are not categorized • Page 86-87 in textbook outline global income
“Industrial Market Economies” • Page 88 shows the 23 industrial market countries as of 2003 (per capita income) • 1) Switzerland $36,970 • 2) Japan $35,990 • 3) Norway $35,530 • 4) United States $34,870 • 5) Denmark $31,090
“Industrial Market Economies” • These countries are highly interdependent (economic conditions in one country spread to others) • As a result these countries must pay close attention to each others economic policies • Not on the list are high income oil exporting countries like Libya, Saudi Arabia, Kuwait (World Bank considers these countries to still be developing
Developing Countries • U.S. imports agricultural produce and minerals from developing countries • Imports- • U.S. exports many manufactured goods to these countries • Exports-
U.S. Imports • Imports from China have grown 665 percent since 1992. Imports from Mexico have grown 343 percent over the same period. • The U.S. is the world's largest market for exporting countries. In 2004, it imported more than $1.3 trillion worth of merchandise. Of the total 2004 U.S. imports, half came from the four top trading partners: Canada (17 percent), China (13 percent), Mexico (11 percent), and Japan (9 percent).
International Sector Spending • U.S. activity with the rest of the world includes U.S. spending on foreign goods and foreign spending on U.S. goods • As of 2003 Canada and Japan played a huge role in U.S. trade (roughly 1/3 of exports and more than 1/3 of imports) • U.S. trade with industrial countries is approximately twice as large as trade with developing countries
International Sector Spending • Trade Surplus- • Trade Deficit- • Net Exports- • Prior to the 1960’s the U.S. exported more than it imported, but since 1976 net exports have been negative (U.S. has been in a trade deficit)
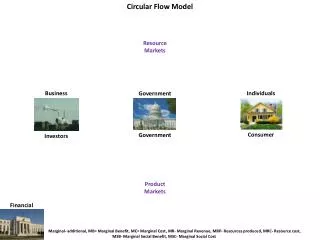
Linking the Sectors • See page 124 circular flow diagram and/or handout • Financial Intermediaries- • Circular Flow-Diagram-