Download
1 / 24
240 likes | 426 Views
Environmentally Impaired Property Transaction Analysis Combining Decision Trees and Monte Carlo Simulation. Timothy Havranek and Poh Boon Ung October 2007. Background Information Modeling Process Decision Tree Results. Agenda. Estimate probable remediation costs

E N D
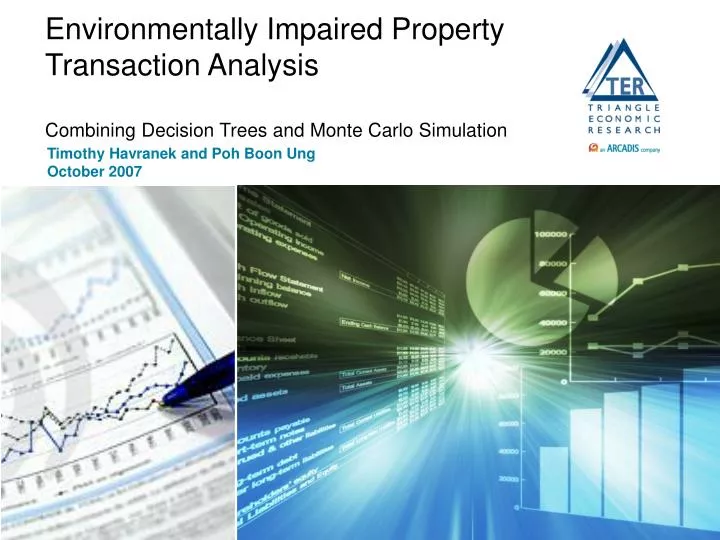
Environmentally Impaired Property Transaction AnalysisCombining Decision Trees and Monte Carlo Simulation Timothy Havranek and Poh Boon Ung October 2007
Background Information Modeling Process Decision Tree Results Agenda
Estimate probable remediation costs Work in support of purchase negotiations of an environmentally impaired property Client is a property development company: Would acquire liability for historical environmental impacts Seeking strategic plan for least cost remediation in light of uncertainties Planned to use estimate in support of lowering purchase offer Current property owner had filed Chapter 11 bankruptcy procedures which complicated the negotiation process Project Background and Objective
Property was former metals processing plant Soil, groundwater, surface water, and wetlands impacted by lead, arsenic and chromium Groundwater also impacted by petroleum hydrocarbons Property is over 150 acres in size and located near a major river Property could be redeveloped for industrial, commercial, or municipal use Current owner under a consent order to perform environmental cleanup Site Background
Decision Analysis Process Decision Process Framing Modeling Evaluation & Sensitivity Analysis Decision Action Plan
Capital and Operations & Maintenance (O&M) costs were estimated using standard engineering costs forms Pert Distributions used to estimate uncertainties in quantities, unit prices, installation year, and O&M durations Engineering costs sheets were linked to 30-year cash flow model for each remedial technique Net Present Value for each remedial technique linked decision tree and Monte Carlo simulation model Model Structure
Visual representation of available choices Valuable communication tool Helps organize alternatives Provides a working map of the project strategy Benefits of Decision Tree
Net Present Value: Frequency Histogram *Distribution based on values of one sampled path per iteration and decisions follow current optimal path
Net Present Value: Risk Profile *Distribution based on values of one sampled path per iteration and decisions follow current optimal path
Output Statistics (cost in millions)*Results based on values of one sampled path per iteration and decisions follow current optimal path
Net Present Value: Frequency Histogram * Distribution based on values of one sampled path per iteration and decisions may change (based on expected values)
Output Statistics (cost in millions)*Results based on values of one sampled path per iteration and decisions may change (based on expected values)
Net Present Value: Frequency Histogram * Distribution based on expected value of model per iteration and decisions follow current optimal path
Output Statistics (cost in millions) * Results based on expected value of model per iteration and decisions follow current optimal path
Sensitivity Analysis on Impermeable Wall Failure Probability
Important to apply appropriate settings in modeling process Internal management and understanding Negotiation process Sensitivity analysis useful to identify decision break-points Results are being used in negotiations process; client is actively using the results in negotiations to buy the site Decision tree analysis assisted in: Identifying optimum strategy Communicating path forward Determining the response and potential effects to chance outcomes Combination of Monte Carlo simulation and decision tree analysis provides additional insights into range of potential outcomes Results and Conclusions