Download
1 / 29
290 likes | 399 Views
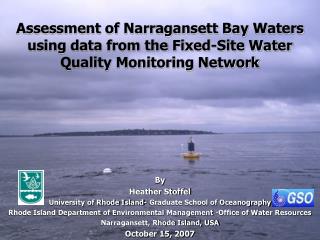
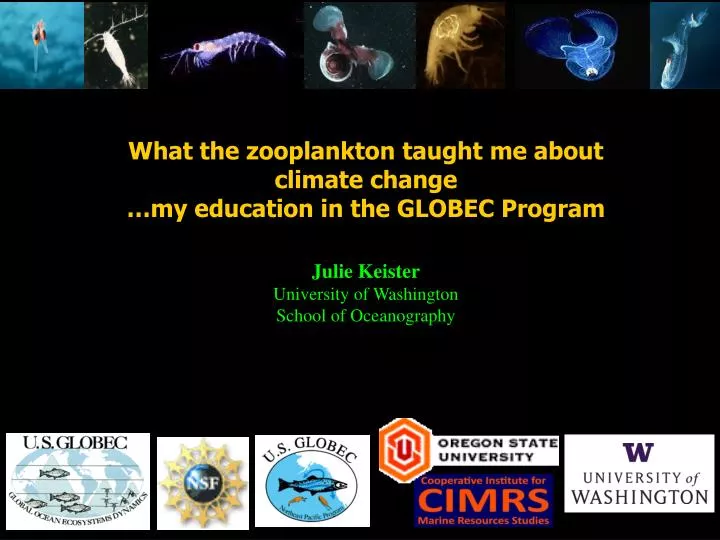
What the zooplankton taught me about climate change …my education in the GLOBEC Program. Julie Keister University of Washington School of Oceanography. U.S. GLOBEC Northeast Pacific Program. Long-Term Observation Program. Mesoscale Process Studies. Ocean color.

E N D
What the zooplankton taught me about climate change …my education in the GLOBEC Program Julie Keister University of Washington School of Oceanography
U.S. GLOBEC Northeast Pacific Program Long-Term Observation Program Mesoscale Process Studies Ocean color • To provide climatology background and variability Core NEP Hypothesis: Spatial and temporal variability in mesoscale circulation is the dominant forcing on zooplankton distribution, biomass, production, retention and loss from coastal areas. Large scale climate variability Mesoscale physical variability Zooplankton variability Ecosystem change
U.S. GLOBEC Northeast Pacific Program Surface Temperature Mesoscale Process Study Region Newport Cape Blanco Crescent City Eureka Pt. Arena
Survey vessel: • SeaSoar • Bio-acoustics • ADCP • Optical Plankton Counter • AC-9 (optics) • Process vessel: • Zooplankton nets • CTD casts • Rate measurements • Mammal and seabird observations NEP Mesoscale Process Studies Cruises:June and August 2000 / 2002 3 vessels per cruise (Survey, Process, Fish) • Fishing vessel: • Nekton • Salmon prey fields • CTD casts
RV New Horizon GLOBEC August 2000 CCS Mesoscale cruise Satellite SST : 1 August 2000 °C
August 2000 Mesoscale cruise: Sea surface temperature from the AVHRR ADCP profile: 17m 200m East component (cm/s) (blue = west) -20 cm/s 17m 200m North component (cm/s) (pink=north) 20-30 cm/s ADCP figure from Barth et al. 2005
August 2000 Strong physical control of biological patterns Calanus marshallae (cold-water, boreal species) Ocean color Calanus pacificus (warm-water species) Copepod Biomass Sea Surface Temperature 44N 43N 42N 127W 125W 127W 125W 127W 125W 127W 125W 127W 125W Keister, Peterson, and Pierce, 2009
Population and biomass loss from coastal regions: Sea surface temperature from the AVHRR 0-100 m velocities from ADCP Loss of ~2% / day of total coastal biomass >1200 tons C / day >900 tons C / day Keister, Peterson, and Pierce, 2009
25 20 15 10 5 0 -5 -10 -15 -20 -25 25 20 15 10 5 0 Spatial and temporal variability in mesoscale circulation J Keister and PT Strub, J Geophys. Res., 2008 Energy (cm2) in 4-12 week periods Sea level anomaly (cm) 48 46 44 42 40 38 36 48 46 44 42 40 38 36 Latitude (°N) 1993 1995 1997 1999 2001 2003 2005 1993 1995 1997 1999 2001 2003 2005
2005 1993 1994 1995 1996 1997 1998 1999 2000 2001 2002 2003 2004 Index of Mesoscale (4-12 week period) Energy 4-12 week variability in SSH averaged over 36° to 43°N, 1° to 3° offshore 1 Normalized power 0 Mechanisms remained unclear…… Keister and Strub, 2008
Dominance of the mesoscale? Large scale climate variability Mesoscale physical variability and transport dynamics Zooplankton variability Ecosystem change
48 46 44 42 40 38 36 126 124 122 U.S. GLOBEC Northeast Pacific Program Long-Term Observation Program Newport Hydrographic (NH) Line NH5 zooplankton time series NH10 mooring Newport Cape Blanco Crescent City Eureka Pt. Arena
El Niño distributional shifts: • Sagitta pseudoserratodentata Sagitta hexaptera • Centropagesbradyi • Offshore taxa • Nyctiphanes simplex • Coastal, cold-water taxon Keister et al. 2005
El Niño distributional shifts: Nyctiphanes simplex abundance at NH-5 1 0.5 12 Dec ‘97 0 Jan 96 Jan 97 Jan 98 Jan 99 Jan 00 Jan 01 12 Nov ‘98 Kosro 2002: Anomalous poleward velocities at NH10= 13.7 cm/s (350 km/month) • Estimated 3.3 months to arrive off Oregon • Actual arrival – 3 weeks later Keister et al. 2005
2 1 Quantifying zooplankton community variability Community cluster time series 2 Jan-99 Jan-02 Jan-03 Jan-05 Jan-06 Jan-07 Jan-97 Jan-98 Jan-01 Jan-04 Jan-00 Jul-97 Jul-98 Jul-00 Jul-01 Jul-02 Jul-03 Jul-04 Jul-05 Jul-06 Jul-96 Jul-99 1 Non-Metric Multidimensional ordination Axis 2 (13%) - 2 - 1.5 - 1 - 0.5 0 0.5 1 1.5 2 Axis 1 (71%) Cold-water/coastal community Warm-water/oceanic community
“Copepod Community Index” = CCI Ordination Axis 1 scores PC1 of copepods 2 1 CCI Timeseries 0 CCI score 2 Warm Cold Cold Warm -1 1 -2 Monthly anomalies 0 2000 2000 1996 1996 2002 2002 2006 2006 2008 2008 2004 2004 1998 1998 CCI score -1 PDO:CCI correlation R = 0.5, p<0.01 -2
Calanus marshallae Oithona similis Acartia longiremis Paracalanus parvus Pseudocalanus mimus Not all copepods are created equal! Boreal species = larger and lipid filled Copepod Community relates to salmon survival: Calanus 3mm Cold years Warm years
6 5 6 5 6 0 6 0 5 5 5 5 5 0 5 0 4 5 4 5 4 0 4 0 3 5 3 5 3 0 3 0 2 5 2 5 170 160 150 140 130 120 110 110 170 160 150 140 130 120 Climate-Forcing Hypothesis: Basin-scale circulation links the PDO to local ecosystem change. PDO - Cold Phase PDO - Warm Phase Strub, modification of Cheltonand Davis, 1982
Basin-scale control of ecosystems? E. Di Lorenzo J. Keister A. Thomas PT Strub WT Peterson S. Bograd P. Franks F. Schwing K. Chaak A. Bracco International collaborators: Japanese: (Chiba, Sasai, Sagaki, Tagushi, Ishidi, Nonaha), Chilean: (Escribano, Hormazabal, Pizarro, Rutllait, Montecino); Canadian (Mackas, Foreman, Pena, Crawford) collaborators on physics and biological variability
Transport pathways explain an important part of copepod community structure:
The test? Compare modeled transport to zoop. observations • Nested ROMS model http://www.myroms.org/) • 10 km resolution • 30 vertical layers • boundary conditions from World Ocean Atlas climatology • nudged at open boundaries • forced by NCEP winds and SST • 1950-2008 • Passive tracers released continuously along the 4 regional domain boundaries (NORTH, SOUTH, EAST, WEST) with 12-month decay scales. • Time series integrated over 1x2 degree region centered on zooplankton observations.
Passive Tracer Time Series 4 From NORTH 3 2 1 0 -1 Model hindcast CCI = NORTH tracer + SOUTH tracer + EAST tracer + WEST tracer + ε From WEST 3 2 1 0 -1 From EAST 3 2 1 0 -1 -2 From SOUTH 2 1 0 -1 -2 -3 1955 1965 1975 1985 1995 2005 Keister et al. 2011
Advective control of zooplankton communities? R = 0.36 Model hindcast CCI Observed CCI R = 0.95 Model hindcast CCI Observed CCI (5 year lowpass) R = 0.9 Model hindcast CCI Model PDO (5 year lowpass) 1998 2000 2002 2002 2004 2004 2006 2006 2008 2008 1998 2000 1960 1970 1980 1990 2000 Keister et al. 2011
How do large-scale climate modes drive coherent ecosystem changes around ocean basins?
Low-Frequency Zooplankton and Transport Dynamics in the KOE S. Chiba (JAMSTEC, Japan) A. Davis (GaTech, USA) J. Keister (UW, USA) H. Song (UCSD) B. Taguchi (JAMSTEC) E. Di Lorenzo (GaTech) OFES Model 10 km resolution 1950-2009 1960-1975 1981-1999 Change in distributions of warm and cold-water copepods pre- and post- regime shift Chiba et al. 2010 Abundance
What I we learned Large scale climate modes A LOT !! Mesoscale transport dynamics Basin-scale transport dynamics Zooplankton variability Ecosystem change
Looking ahead: • Interdisciplinary science is necessary to understand complex systems and problems • Time series observations are gold • “You can learn a lot by looking” • Need big thinkers, synthesis ideas • Trend toward larger collaborative, or smaller, individual, projects? • Looking forward to future collaborations !
Sanae Chiba, HiroSugisaki JAMSTEC, Japan Cynthia Suchman NPRB Dave Mackas Fish and Oceans Canada Zooplankton ecology Emanuel Di Lorenzo GA Tech U ROMS Modeler Collaborations developed, friends made Tim Cowles, Hal Batchelder, Ted Strub, Bill Peterson Ph D Committee RicBrodeur, Kym Jacobson, Bob Emmett, Bill Peterson, Tom Wainwright, Peter Lawson, Ed Casillas NOAA NWFSC, Salmon biology Andy Thomas, Jack Barth, Steve Pierce, Ricardo Letelier, Yvette Spitz, Mike Kosro, Meng Zhou GLOBEC Mesoscale Studies Steve Bograd, Frank Schwing NOAA SWFSC Rodger Harvey, Se-Jong Ju University of Maryland Euphausiid aging Jaime Gomez CICIMAR, Mexico Euphausiid ecology The Peterson Lab! Zooplankton ecology Patrick Ressler NOAA AFSC Bioacoustics Jane Huyer, Bob Smith, Pat Wheeler, Ev and Barry Sherr, Mike Kosro NEP GLOBEC LTOP