Download

1 / 83
910 likes | 1.29k Views
Comparison and Analysis of the 4 Market Structures . Mo(o)nopoly. PC. Ideal/Best market structure. MPC. Oligopoly. Is There A “Best” Market Structure?. Common criterion/yardsticks for comparison. Economic Efficiency Allocative Efficiency Productive Efficiency Price and output level

E N D
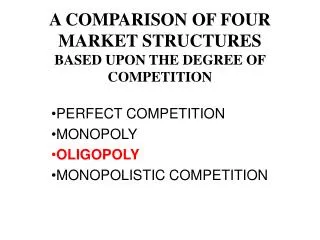
Comparison and Analysis of the 4 Market Structures Mo(o)nopoly PC Ideal/Best market structure MPC Oligopoly
Is There A “Best” Market Structure? Common criterion/yardsticks for comparison • Economic Efficiency • Allocative Efficiency • Productive Efficiency • Price and output level • Variety of products • Profitability of firms • Research and development • Innovation and new products • Theory vs empirical evidence
Comparison of Market Structures Economic Efficiency (Revision) Importance of definition
Comparison of Market Structures Economic Efficiency • Pareto Optimum situation • It is not possible to change production in such a way to make everyone better off • It is not possible to make someone better off without making someone worse off. • Efficiency in production (Productive Efficiency) • Efficiency in terms of types of goods produced (Allocative efficiency)
Comparison of Market Structures Allocative Efficiency • Occurs when it is not possible to change the allocation of resources to make everyone better off. • Allocation of resources refer to the distribution of resources among the types of good to be produced. • Main objective: Correct product mix
Comparison of Market Structures Allocative Efficiency Assuming the absence of externalities and public goods and other sources of market failure, allocative efficiency is achieved when: • P=MC • Price = value of the benefit received by the consumer • MC= opportunity cost of resources used in the production of the additional unit of the good = value of benefit received by consumer of the alternative good
Eg: • Pair of shoe • Price = $40 • MC = $30 • Value created by the pair of shoe is greater than the value loss by the diversion of resources to produce the shoe. • If P > MC, society will benefit further if more resources are allocated to this good. • If P < MC, society will benefit further if less resources are allocated to this good. • Allocative efficiency : P=MC
Illustrating Allocative Efficiency Conditions MSB = MSC P = MC 9
Allocative efficiency For units above 9 units, e.g. 10th unit: P (MB) < MC: society values last unit of the good less than opp cost of producing that unit won’t produce that unit For units below 9 units, e.g. 8th unit: P (MB) > MC : society values last unit of the good more than the opportunity cost of producing that unit will produce that unit 9
Allocative Efficiency Will the 9th unit be produced? Yes. P = MC: value society places on consumption of that last unit of good is equal to opportunity cost of producing it. Right amount and type of goods are produced to maximise society’s welfare. SMB = SMC 9
Is society producing what society wants & in the quantities desired by society?
Comparison of Market Structures Productive Efficiency • Firm’s point of view: Allpoints on LRAC curve are productively efficient Represent the lowest average cost in producingthat given level of output (X-efficiency) • Society’s point of view: Only minimum LRAC is productively efficient ie. minimum efficient scale (MES). All IEOS have been exploited
Comparison of Market Structures PC Firm vs Firms Under Imperfect Markets • Assume • Long run equilibrium • Profit maximising aim • Normal profits • Take note that PC and MPC firms must and can only make normal profits in the long run (no entry barriers) • Monopoly and oligopoly may make normal profits in the long run but they usually make supernormal profits in the long run due to entry barriers
Comparison of Market Structures Allocative Efficiency: P= MC Firm under Perfect Competition vs Firm under Imperfect Market • Is the PC firm allocatively efficient? • Is the firm in imperfect markets allocatively efficient?
p LRMC LRAC p* MR = AR q* LR Eqm of the PC Firm Allocatively Efficient P = MC
LR Eqm of Firm in Imperfect Market MC LRAC A P AR MR q Allocatively inefficient: P > MC Price Output 0 .
Comparison of Market Structures Productive Efficiency from society’s viewpoint: Production occurs at minimum LRAC Firm under Perfect Competition vs Firm under Imperfect Market • Is the PC firm productively efficient? • Is the firm competing under imperfect market structures productively efficient?
p LRMC LRAC p* MR = AR q* LR Eqm of the PC Firm The profit-max price taker makes normal profits in LR • Productively Efficient producing at min LRAC (MES)
LR Eqm of Firm in Imperfect Market Productively inefficient from society’s viewpoint: Not producing at min LRAC (MES) .
Eg. Monopolistically competitive firm– can only make normal profit in the long run MC LRAC A P AR MR q Price Productively inefficient from society’s viewpoint: - Not producing at min LRAC (MES) Output 0 .
Monopoly– if it makes normal profit in the long run MC LRAC A P AR MR q Price Productively inefficient from society’s viewpoint: - Not producing at min LRAC (MES) Output 0 .
Monopoly – if it makes SNP in the long run MC LRAC A P AR MR q Price Productively inefficient from society’s viewpoint: - Not producing at min LRAC (MES) Output 0 .
Monopoly– if it makes supernormal profit in the long run MC LRAC A P AR MR q Price Productively efficient from society’s viewpoint by coincidence: -min LRAC (MES) Output 0 .
For now, it seems that… Efficiency is used as a yardstick for comparison However, there are other criteria that can be used for comparison between market structures
Is There A “Best” Market Structure? Common criterion/yardsticks for comparison • Economic Efficiency • Allocative Efficiency • Productive Efficiency • Price and output level • Variety of products • Profitability of firms • Research and development • Innovation and new products • Theory vs empirical evidence
Comparison between PC and Monopoly Market Assumption: • Before :Industry is made up of many small firms (PC). • After:one firm buys out all the other firms and creates a monopoly. • Compare Price and output under PC and Monopoly
Price S(MC) PM P=MC PC D(AR) MR 0 C M Quantity Comparing PC and single-price Monopoly for price and output OC > OM and PC < PM Monopolist charges a higher price for a lower output.
Price S(MC) Pa P=MC PC D(AR) 0 C Quantity Comparing PC and price-discriminating monopoly for price and output PC industry’s output is 0C, where P=MC. = MRPD If the monopolist practises perfect PD, his output is also 0C.
Consideration of EOS When all the PC firms merge to form one large monopolistic firm, economies of scale are possible. MC curve shifts down If IEOS enjoyed issubstantial, then consumers may get to enjoy a higher quantity of output at lower prices
C/R PC PM M 0 Quantity C Presence of substantial economies of scale S(MC) MCM OM > OC and PM > PC D(AR) MR PC industry’s output is where S = D, i.e. at 0C. Monopolist’s output is where MR = MCM , i.e. at 0M. Monopolist charges a lower price for a higher output.
Comparison between PC and Monopoly Market • Compare consumer’s surplus and producer’s • surplus under PC and Monopoly • Under PC market surpluses are maximised • Under Monopoly a deadweight loss is experienced
Monopoly Deadweight welfare loss Em Ec R D T Pm MR qm Deadweight loss under monopoly MC (= S under perfect competition) $ A Consumer surplus Pc Producer surplus D O qc Q fig (b) PC Industry vs Monopoly
Comparison efficiency between PC and Monopoly Market • Compare efficiency under PC and Monopoly • Productive efficiency • Allocative efficiency
Comparing PC and Monopoly for productive efficiency Perfect Competition: • In LR each firm produces not only on the LRAC but also at the min. point of its LRAC curve. • Since all firms produce where P=MC and P is the same for every firm, then MC is the same for every firm. productive efficiency (firm’s perspective and society’s) is achieved under PC.
Comparing PC and Monopoly for productive efficiency Monopoly: • Monopolist has incentive to operate on the LRAC in order to minimise costs. • However, the equilibrium output will NOT correspond to LRAC’s minimum. productive efficiency (firm’s perspective) can be achieved under a monopoly. However it is productively inefficient from society’s perspective .
X- inefficiency • A firm under perfect competition is a price taker only way for it to stay in business is to be as cost efficient as possible. • If less efficient than other firms, may not make sufficient profits to stay in business in long term. • However for the monopolist, without competitive pressures on profit margins, may allow cost controls to become lax • overstaffing • spending on prestige buildings and equipment • There is also less effort to keep technologically up to date (eg research in new products) or to develop new domestic and export markets.
X- inefficiency • Result : • costs will be higher than what is possible • more resources than necessary are used in production less output for the given amount of resources that the economy possess.
X- Inefficiency Evaluation: • With globalisation and international competition, even a monopoly may be “competitive”. Why? • markets global in scale • less barriers to trade fiercer competition from abroad • threat of potential competition
Comparing PC and Monopoly for allocative efficiency Perfect Competition: • Every firm produces where MR=MC • But since AR=MR=P, then every firm produces where P=MC allocative efficiency is achieved. Monopoly: • Firm produces where MR=MC • But since AR (or price) > MR P > MC allocative efficiency is not achieved by the single-price monopolist However, it is achieved when perfect PD is practised.
Price S(MC) Pa P=MC PC D(AR) 0 C Quantity Comparing PC and price-discriminating monopoly for price and output PC industry’s and Monopolist’s output is 0C, where P=MC. = MRPD If the monopolist practises perfect PD, AE can be achieved.
Dynamic efficiency (Innovation) • Dynamic efficiency refers to the advantagesthat result from innovation in process & product. • Greater level of innovation can result in • lower costs due to the development of better method of production • better product with more features, higher level of reliability, more user friendly- improve consumers’ well-being • growth – improvement in technology will result in greater productivity and more growth
Dynamic efficiency (Innovation) Pg 29 & 31 PC firms • will always earn normal profit in LR • cannot afford R & D without the financial resources • Perfect information means innovations are quickly replicated by competitors • there is no incentive as innovating firm cannot enjoy fruits of its innovations Monopoly • can earn supernormal profit even in long run • can afford R & D and there is incentive to innovate
Is Perfect Competition the Most Ideal?Counter-argument: Not if other yardsticks are used • presence of externalities causes market failure even if it is perfect competition • lack of variety of products/services • supernormal profits not necessarily undesirable: • Supernormal profits provides funds for R&D • PC firms can only make normal profits in long run
Is Perfect Competition – Most Ideal?Counter-argument:Not if other yardsticks are used • PC not a realistic representation of most markets. • But it helps us to understand how markets work to achieve efficiency in resource allocation under ideal situations. • Helps government to implement policies to improve efficiency and welfare in markets
Is Monopoly the Society’s villain? • “No point is better accepted… than that the monopoly price is higher and the output smaller than is socially ideal. The public is the victim.” JK Galbraith, Economics and the Public Purpose, 1974 • “Monopolies are like babies. Nobody likes them till they’ve got one of their own” Sir John Hicks
Is Monopoly the Society’s villain? • Generally not well regarded • Allocatively inefficient • Price > MC • Output below optimum output level • X – inefficient wastage of resources • Unequal income distribution
Is Monopoly the Society’s villain? • However there are merits of monopoly 1. Research and development Supernormal profits used to finance R & D • improved technology • lower costs of production • With reference to a diagram, how does R&D affect the monopoly’s LRAC? • Successful R&D will lead to a downward shift of the LRAC curve • development of new/better quality products (vs perfectly competitive markets inability to earn more than normal profits restricts such investment) 2. Substantial EOScan lead to lower prices andlargeroutputfor consumers higher consumer surplus
Is Monopoly the Society’s villain? 3. Innovation and new products • Joseph Schumpeter : Creative Destruction • possibility of monopoly profits stimulates new entrants producing new and competing products. • entry barriers not a serious problem in the VERY long run • entry barriers - very stimulus to the creativity required to destroy the barriers • monopoly profit is ‘the most powerful engine of progress and in particular, the long run expansion of total output’. • “Perfect competition is not only impossible but inferior and has no title to being set up as a model.”
Is Monopoly the Society’s villain? 4. Reduction of Wasteful Competition 5. Price discrimination, in some instances, may benefit society
Mo(o)nopoly PC Ideal/Best market structure Oligopoly