Download
1 / 9
90 likes | 173 Views
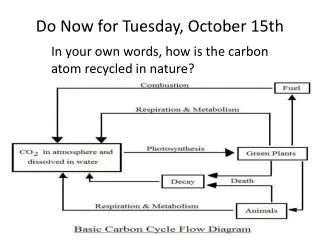
ESS 1. October 15th. SWBAT: describe methods for measuring abiotic and biotic components of ecosystems . OA : List the Symbiotic relationships and who benefits in each. (table) Homework: make a dichotomous tree for 8 different species of your choice . And Exercises on p. 35.

E N D
ESS 1 October 15th SWBAT:describe methods for measuring abiotic and biotic components of ecosystems. OA:List the Symbiotic relationships and who benefits in each. (table) Homework: make a dichotomous tree for 8 different species of your choice. And Exercises on p. 35.
Taking Measurements http://www.twitvid.com/MXMYD Anemometer—wind speed http://www.youtube.com/watch?v=SmzJtca7uNY Using a secchi disk http://www.youtube.com/watch?v=cP0lMQjjyUI Collecting data
Field Studies Measuringthe Biotic Components http://www.youtube.com/watch?v=HxaFB_UGtxE Field study of Bees http://www.offwell.free-online.co.uk/lincoln.htm Lincoln Index
Quadrats 200 1000
After fogging the trees in Panama, Terry Erwin and colleagues Collect insects from the canopy. (note: uses non-toxic method)
Biomass • Dry weight of organisms • Estimated from the dry weight of one organism and the number of organisms. • To determine dry weight, dry at 80oC and leave for a time. Weigh the object. Repeat until no change in weight.
Diversity and Simpson’s Diversity Index D= Diversity Index N= total number of organisms or percentage n=number or percentage of organisms of a particular species. ∑= sum of D= N(N-1) ∑ n(n-1) High value of D means—stable and ancient site (very diverse) Low value of D might mean pollution, recent colonization or agricultural management (low diversity)
More on Simpson’s Index • Note that D is a RELATIVE measure—it only means something in relation to a previous measure of the same location or a similar community.