Download
1 / 11
120 likes | 436 Views
Mean Absolute Deviation and Dot Plots. Bellringer. The table below displays data that Melissa collected from 10 of her friends. She asked them how many times they swam at the beach last month. Using this data, complete the questions.

E N D
Bellringer The table below displays data that Melissa collected from 10 of her friends. She asked them how many times they swam at the beach last month. Using this data, complete the questions. 1. Fill in the blanks for theblue and orange categories.(MAD is mean absolutedeviation).
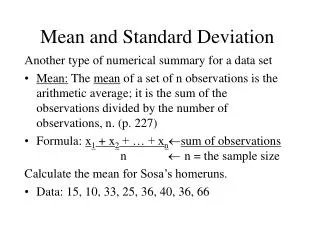
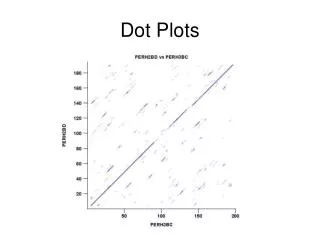
Mean, Deviation from the Mean, Mean Absolute Deviation, and Dot Plots • In pairs • Each partner will recite the steps to solving for the mean, deviation from the mean, and mean absolute deviation. While one recites the other will listen. • If the steps are correct, then praise your partner. • If the steps are incorrect or if your partner is missing a step or two, coach your partner to recite the correct steps. • Begin speaking when the timer begins. • When the timer buzzes, switch speakers. • With your partner, describe the steps on how to set-up a dot plot in the same format.
Mean Absolute Deviation • MAD is that many points away from the mean both left and right on a dot plot. John surveyed 12 of his friends, asking them each to tell him how many siblings their dad and mom each have. Mean = 2.6 MAD = 1.1 • With your partner, compare the two sibling counts: • Means • Mean absolute deviations Mean = 2.6 MAD = 1.3
Who’s Taller? • Look around the room. • Try to make a prediction on what the average height of a 7th grade boy is compared to the average height of a 7th grade girl. • Who might be taller?
Lesson Activity: Who’s Taller? • You and your partner will collect the height of each other and record the number in inches. • One at a time, you and your partner will stand under each marked line to see which height you are closer to. The measures are already marked on the wall (in feet and inches). • As I record the numbers, you will record the numbers in the appropriate table. • Complete the tables and questions.
Group Work Two close pairs need to pair up to make a group of 4.
Compare Answers • Each pair will talk about their findings and compare answers.
When will I use this? • Think of a situation in which it would be helpful to know the mean absolute deviations of two data sets. • Suggestion: Suppose a teacher writes two versions of a test covering the same subject. To be a good test, students should score about the same on both tests. How would knowing the mean absolute deviations of the scores help? The MADs of the scores on the two tests would show whether students as a group were scoring roughly the same on both tests.
Exit Slip The tables on the next slide show data that Melissa collected from 10 of her friends. She asked them how many times they swam at the beach last month. She also asked her friends how many times last month they swam at a local pool. Using this data, answer the questions on your sheet of paper.