Download
1 / 16
160 likes | 163 Views
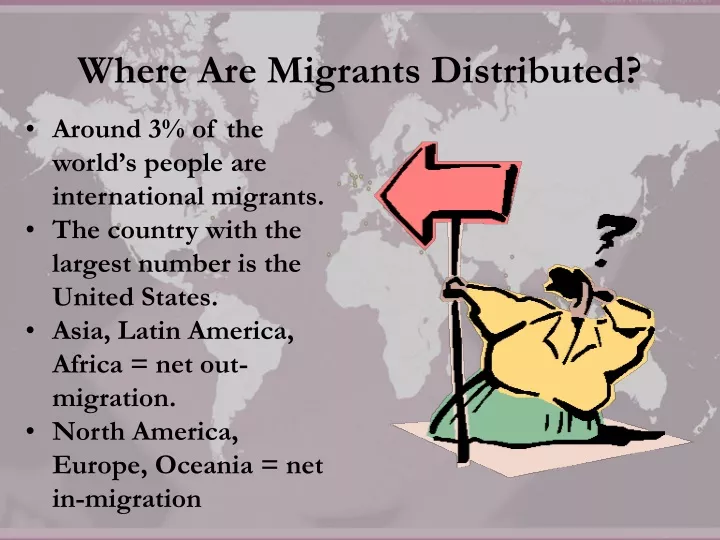
Where Are Migrants Distributed?. Around 3% of the world’s people are international migrants. The country with the largest number is the United States. Asia, Latin America, Africa = net out-migration. North America, Europe, Oceania = net in-migration. Global Migration Patterns.

E N D
Where Are Migrants Distributed? • Around 3% of the world’s people are international migrants. • The country with the largest number is the United States. • Asia, Latin America, Africa = net out-migration. • North America, Europe, Oceania = net in-migration
Global Migration Patterns • Population of the US includes about 30 million people born in other countries. • Even though we have the larger # of immigrants, we have a smaller % of immigrants than many other countries. • Highest % = Middle East (one half the pop.)
US Immigration Patterns • US since 1820 = 70 million • Three main areas in US immigration. • Colonization from England and Africa. • Slavery • Europeans = voluntary • In last 500 years, 65 million Europeans have migrated to other continents. • 40 million destined for US.
European Immigration • 1st Peak = 1607-1840 2m. USA • 1840-1850 = 4m. migrated w/ 90% from North and West Europe (2/5 = Ireland, 1/3 = Germany) • 2nd Peak = Civil War creates US decline. • During 1880s, ½ million people annually. • ¾ in 1880s came from Northern & Western Europe.
European Immigration • Bad economy in 1890s = little immigration. • 3rd Peak = 1907 with 1.3 million people. • Most came from countries who had sent few people before. • ¼ = Italy, Russia, Austria-Hungary • Coincided with Industrial Revolution to Southern and Eastern Europe.
Less Developed Regions • Immigration in US dropped sharply in 1930s-1940s, during Great Depression and World War II. • Increased from 1950-1970, and surged during 1980-1990 to high levels.
Immigration from Asia/L. America • Asia = leading in immigration b/w 1970-1980. • Account for 40% OF Canadian immigrants. • Latin America = 2m. from 1820-1960; 11m. from 1960-2000. • Large influx due to 1986 Immigration Reform & Control Act = issued visas to several hundred thousand who entered US previously without proper legal documentation.
Demographic Transition - Europe • Rapid population growth fueled emigration especially after 1800. • New technology pushed most of Europe into Stage 2. • To promote efficient agriculture, some governments forced the merge of small farms into large units. • Displaced farmers = 2 choices
Undocumented Immigration to US • AKA = illegal immigration • 7 million undocumented immigrants in US • Other estimates at 20 million. • BCIS apprehends around 1 million a year who try to cross Southern border.