Download
1 / 8
80 likes | 90 Views
The Optimization of Neural Networks Model for X-ray Lithography of Semiconductor. ECE 539 Project Jialin Zhang. Introduction.

E N D
The Optimization of Neural Networks Model for X-ray Lithography of Semiconductor ECE 539 Project Jialin Zhang
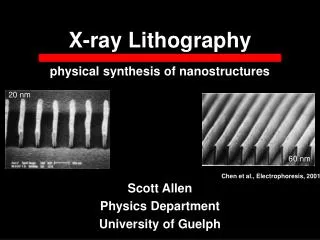
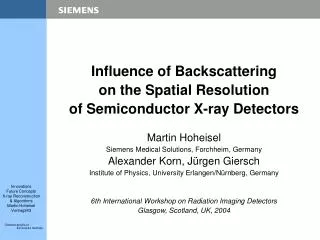
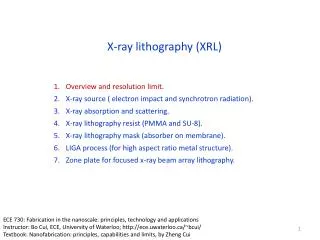
Introduction • X-ray lithography with nm-level wavelengths provides both high structural resolution as good as 0.1 μm and a wide scope of advantages for the application in semiconductor production. The parameters such as gap, bias, absorb thickness are important to determine the quality of the lithography. • This project deals with optimization of parameters for semiconductor manufacturing, in the case of x-ray lithography.
Data and Existing Approach • Data source: 1327 train samples,125 test samples--Department of Electrical and Computer Engineering and Center for X-ray Lithography • Data structure: 3 inputs--absorber thickness, gap, bias 3 outputs--linewidth, integrated modulation transfer function, fidelity • Existing Approach:A neural network based on radial-basis function the multivariate function: (linewidth, IMTF, fidelity)=F(absorber thickness, gap, bias) 125 training samples: regularly distributed in the input space error performance: (tested on the test samples, ”Point to Point”) mean error: 0.2% ~0.4 % maximum error: 4%
Goal • decrease the number of training samples necessary to obtain a mapping from the inputs to the outputs • improve the error performance ---the ideal maximum error is below 0.1%
Decrease training samples number • Pre-Process the training data Data distribution feature: (After recombining the data set ) Range of the data set of 1452 sample: 200,220,240,260,280,300,320,340,360,380,400—11(absorber thickness) 10000,12000,14000,16000,18000,20000,22000,24000,26000,28000,30000-10(gap) -18,-14,-10,-6,-2,2,6,10,14,18,22,26—12(bias) Input Range: -0.2~0.4 Train sample: 64 Test sample: 125 • Approach: Radial-basis Function Parameter choosing( λ, σ)
Decrease training samples number Result: • A mapping from the inputs to the outputs based on radial-basis function is obtained by training 64 training samples and choosing the optimal parameters for radial-basis function. • The “Point to Point” mean errors: 0.7%~0.9% • The “Point to Point” maximum error is 5.6%
Improve the error performance • Approach: Increase the number of training samples --the smallest “Point to Point” maximum error that has ever achieved is 0.4%. use different types of neural networks (Multi-layer Perceptron) --A better error performance is expected to be achieved
Current Result • A mapping from the inputs to the outputs based on radial-basis function is obtained by training 64 training samples (compared with 125 training sample) and choosing the optimal parameters for radial-basis function. The “Point to Point” mean errors are 0.7%~0.9% (compared with 0.2%~0.4%)and maximum error is 5.6%(compared with 4%). • The error performance of the mapping is improved by increasing the number of training samples and the smallest “Point to Point” maximum error is 0.4%(The ideal error performance is below 0.1%).