Download
1 / 69
690 likes | 853 Views
Variational Radar Data Assimilation for 0-12 hour severe weather forecasting Juanzhen Sun National Center for Atmospheric Research Boulder, Colorado sunj@ucar.edu. Outline Background - Motivation - Radar observations and preprocessing

E N D
VariationalRadar Data Assimilation for 0-12 hour severe weather forecasting Juanzhen Sun National Center for Atmospheric Research Boulder, Colorado sunj@ucar.edu
Outline • Background • - Motivation • - Radar observations and preprocessing • Basic concept of variational data assimilation • Variational Doppler Radar Analysis System (VDRAS) • - 4D-Var Framework • - Results from applications • WRF variational radar data assimilation • - 3D-Var • - 4D-Var
Cloud-scale modeling since 1960’s • Used as a research tool to study dynamics of moist convection • Initialized by artificial thermal bubbles superimposed on a single sounding • Rarely compared with observations From Weisman and Klemp (1984)
Yes, it was time thanks to • NEXRAD network • Increasing computer power • Advanced DA techniques • Experience in cloud-scale modeling Lilly’s motivating publication (1990)-- NWP of thunderstorms - has its time come?
0.1 mm hourly precipitation skill scores for Nowcast and NWP averaged over a 21 day period • Current operational NWP can not beat extrapolation-based radar nowcast technique for the first few forecast hours. • One of the main reasons is that NWP is not initialized by high-resolution observations, such as radar. Operational NWP: poor short-term QPF skill From Lin et al. (2005)
6h forecast (July 6 2003) 12h forecast • Without high-resolution data assimilation: • A model can takes a • number of hours to • spin up. • Convections with • weak synoptic-scale • forcing can be missed. Example of model spin-up from BAMEX Radar observation at 0600 UTC at 1200 UTC Graphic source: http://www.joss.ucar.edu
Now the questionCan radar observations be assimilated into NWP models to improve short-term prediction of high impact weather?
Outline • Background • - Motivation • - Radar observations and preprocessing • Basic concept of variational data assimilation • Variational Doppler Radar Analysis System (VDRAS) • - 4D-Var Framework • - Results from some applications • WRF variational radar data assimilation • - 3D-Var • - 4D-Var
Characteristics of radar observations • (i.e.,WSR-88D) • • High spatial and temporal resolutions (1km x 1o • every 5-10 min.) • • Only radial velocity and reflectivity available • • Limited coverage – 50-100km in the clear-air • boundary layer and 200-250km when storms exist • Huge amount of data • In a storm mode, the estimate number of data is • ~ 3 million/5 min from one radar
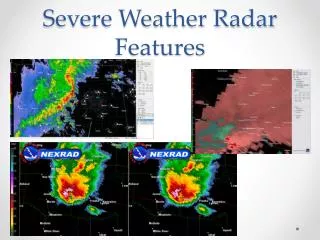
Key challenges for radar data assimilation • Handling large sets of radar data • Quality control • Retrieval of unobserved variables • Model error - Quick nonlinear error growth of convection • Data voids between radars • Computation cost Radial velocities from 20 WSR-88D radars
Objective of data assimilation To produce a physically consistent estimate of the atmospheric flow on a regular grid using all the available information • Available information: • Background – previous forecast, climatology information, • or larger-scale analysis • -- on regular grid • Observations • -- irregularly distributed • 3. Error statistics of the background and observations • Numerical model • Balance equations or constraints
A simple example - Following Talagrand (1997) Assume two pieces of information Tb, To with unbiased and uncorrelated errors ζb,ζoand known variances σb2, σo2 final analysis, Ta Observation Background probability Background: Observation: Temperature Question: What is the best estimate Ta of Tt?
Ta Tb Two basic approaches Direct solution approach: The estimate (or analysis) Tais a linear combination of the two measurements: Unbiased, minimum variance, linear estimate: Variational approach: It can be shown that the above estimate Ta can be also obtained by iteratively minimizing the following cost function
Gain matrix Innovation Generalization Direct solution approach [Kalman Filter (KF)]: Analysis: Covariance: Different approximation of B results in different techniques Examples: Optimal interpolation (OI), Ensemble KF (EnKF) Variational approach: 3D-Var, 4D-Var
Comparing radar DA with conventional DA Conventional DA Radar DA observation model grid
Convective-scale DA • Objective High-impact weather; QPF - Short window, rapid update cycle - High-resolution; convection-permitting • Major data source Radar data; satellite; mesonet - High resolution, but limited variables • Balance constraint Time tendency terms important - 4D schemes, flow-dependent covariance
Horizontal momentum equation: Convective-scale balance Take horizontal divergence: convective scale balance? geostrophic balance nonlinear balance
Outline • Background • - Motivation • - Radar observations and preprocessing • Basic concept of variational data assimilation • Variational Doppler Radar Analysis System (VDRAS) • - 4D-Var Framework • - Results from some applications • WRF variational radar data assimilation • - 3D-Var • - 4D-Var
General description of VDRAS • VDRAS is a 4D-Var data assimilation system for high-resolution (1-3 km) and rapid updated (12 min) wind analysis • It was developed at NCAR as a result of several years of research and development • The main sources of data are radar radial velocity, reflectivity, and high-frequency surface obs. • A nonlinear cloud-scale model is used as the 4D-Var constraint with the full adjoint • It has been installed at more than 20 sites for various applications
History of VDRAS Development milestones 1991:First version of VDRAS developed and successfully applied to simulated radar data (Sun et al 1991) 1997:Extended to a full troposphere cloud model (Sun and Crook 1997,1998) 2001:Applied to lidar data for convective boundary layer analysis (VLAS) 2005: Added the capability to cover multiple radars (Sun and Ying 2007) 2007: Coupling with mesoscale models (mm5 or WRF) 2008: Began to explore how to use VDRAS analysis to initialize WRF
History of VDRAS cont… Real-time installations 1998:Implemented at Sterling, NWS (Sun and Crook 2001) 2000:Installed at Sydney, Australia for the Olympics (Crook and Sun, 2002) 2000-2005: Field Demonstration for FAA aviation weather program 2003-now: Run for various mission agencies (US Army, NWS, DOD) 2006-2008:Real-time demonstration for Beijing Olympics 2008 2010: Real-time demonstration for Xcel Energy Currently: NWS at Melbourne, Florida NWS at Dallas, Texas ATEC at Dugway, Utah Beijing, China Taipei, Taiwan
VDRAS analysis flow chart Mesoscale model output (netcdf) Vr & Ref (x,y,elev) Surface obs. VAD analysis Radar Preprocessing& QC Background analysis Cloud model & adjoint 4DVar Radar data assimilation Last cycle Analysis/forecast Minimization of cost function Updated analysis U, v, w, T, Qv, Qc, Qr
Background term Observation term Penalty term Cost Function vr: radial velocity Z: reflectivity in dBZ xb: background field x0: analysis field at time 0 F: Grid transformation η: Observation erro B: background error covariance; modelled by recursive filter
Observation operators for radar1. Variable transformation • Radial velocity (x,y,z) analysis grid point; (xi,yi,zi) radar location; ri distance between the two; vT =vT(qr) particle fall velocity • Reflectivity • - A complex function of microphysics variables • - Simplified for warm rain and M-P DSD
Observation operators for radar2. Mapping model grid to data grid A sketch of the x-z plane z2 Data grid Model grid z0 z1 radar
Doppler radar data preprocessing • Preprocessing Doppler radar data is an important procedure before assimilation. • It contains the following: • Quality control • To deal with clutter, AP, folded velocity, beam blockage, etc. • Mapping • Interpolation, smoothing, super- observation, data filling • Error statistics • Variance and covariance Local Standard Deviation as an error estimator Signal Noise
Illustrative diagram for 4D-Var Last iteration • • Atmospheric State • ° First Iteration 0 5 10 TIME (Min)
How VDRAS analysis is produced with time 0 min 12 min 18 min 30 min time 6-min Forward Integration 4DVar 4DVar KVNX KDDC KICT KTLX Cold start Mesoscale analysis as first guess 6-min Forecast as first guess; Mesoscale analysis Output of u,v,w,div,qv,T’ Output of u,v,w,div,qv,T’ Model data Sounding VAD profile Surface obs. Model data Sounding VAD profile Surface obs.
Sydney 2000 Tornadic hailstorm November 3rd tornadic hailstorm event, left-moving supercell, clockwise rotating tornado. gust front sea breeze
Sydney 2000 Verification of VDRAS winds using aircraft data (AMDARs)
Cpol Kurnell November 3rd, VDRAS-Dual Doppler comparison ¼ of analysis domain rms(udual – uvdras) = 1.4 m/s rms(vdual – vvdras) = 0.8 m/s
Cpol October 8th, VDRAS-Dual Doppler comparison rms(udual – uvdras) = 2.8 m/s rms(vdual – vvdras) = 2.2 m/s
Real-time demonstration: WMO/WWRP B08FDP Beijing 2008 Olympics Forecasting Demonstration Project
VDRAS cold pool compared with AWS VDRAS verification for Olympics 2008 FDP
Aug. 14 2008 Storm during OlympicsVDRAS continuous analyses of wind and temperature perturbationFrame interval: 24 min
Aug. 14 2008 Storm during OlympicsVDRAS continuous analyses of wind and convergenceFrame interval: 24 min
Aug. 14 2008 Storm during OlympicsVDRAS continuous analysis of wind shear (3.5km-0.187km)Frame interval: 24 min
VDRAS experiements with TiMREXdata from Taiwan VDRAS Domain • 270km2 x 5.625km • with a resolution of • 3km x 0.375km • WRF 3km hourly • forecasts as background • 42 AWS stations • Assimilation window is • 10 min
SoWMEX/TiMREX case of 31 May 2008 QPESUMS accumulated precipitation 00-03 UTC 03-06 UTC 06-09 UTC 09-12 UTC
VDRAS wind analysis from CTRL experiment 03 UTC - 10 UTC
Comparing radial velocities from RCCG and S-Pol Sensitivity experiments to radar quantity RCCG 06 UTC RCCG 03 UTC CTRL: analysis with both S-Pol & RCCG RCCG: analysis with RCCG only SPOL: analysis with S-Pol only SPOL 03 UTC SPOL 06 UTC
Vertical velocity at 06 UTC RCCG Z = 0.937 km SPOL
VDRAS analysis by assimilating 8 NEXRADs over IHOP domain Analyzed temperature Red contour: 25 dBZ ref. Radar radial velocities
VDRAS sensitivity to horizontal resolutionVDRAS continuous analyses of divergence and windFrame interval: 15 min 3KM 1KM
Applications of VDRAS • Predictors for thunderstorm nowcasting • - Checklist • - Thunderstorm forecast rules • Develop thunderstorm conceptual models • High-resolution urban analysis • Initialization of NWP models • Wind energy prediction
0.1 0.3 0.5 Use of VDRAS Vertical Velocities in Thunderstorm Nowcasting 60 min extrapolation Contours of Vertical velocity 0.1 m/s 0.3 m/s 0.5 m/s
0.1 0.3 0.5 Use of VDRAS Vertical Velocities in Thunderstorm Nowcasting Verification
VDRAS diagnosed quantities as storm predictors Courtesy of Xian Xiao (IUM)
Outline • Background • - Motivation • - Radar observations and preprocessing • Basic concept of variational data assimilation • Variational Doppler Radar Analysis System (VDRAS) • - 4D-Var Framework • - Results from some applications • WRF variational radar data assimilation • - 3D-Var • - 4D-Var