Download
1 / 7
70 likes | 237 Views
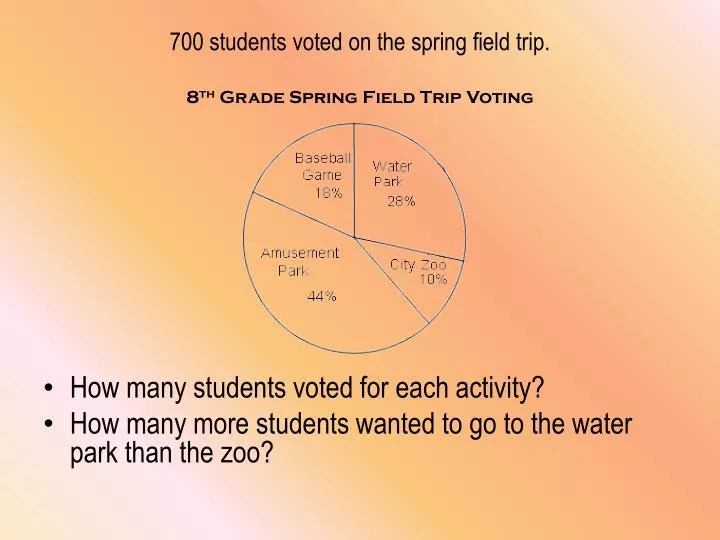
700 students voted on the spring field trip. 8 th Grade Spring Field Trip Voting. How many students voted for each activity? How many more students wanted to go to the water park than the zoo?. 2,000 people voted for mayor today. The graph shows the percentage of each candidate’s votes. .

E N D
700 students voted on the spring field trip. 8th Grade Spring Field Trip Voting • How many students voted for each activity? • How many more students wanted to go to the water park than the zoo?
2,000 people voted for mayor today. The graph shows the percentage of each candidate’s votes. March 2012 Mayor Election Results • How many votes did Mr. Diaz receive? • How many people did NOT vote for Mr. Reid? • Who won the election? How many votes did she receive?
Mr. Milton earns $55,000 a year. His wife does not work. The graph below shows their family budget for this year. • How much money do they spend each year on rent? • How much money do they put in savings? • How much money is spent on clothing and miscellaneous?
700 students came to Open House last fall. Many of these students brought their parents. Fall 2011 Open House • How many students had two parents attend? • How many parents did we have at Open House?
220 girls were surveyed about their favorite sport. Girls’ Sports Survey • How many girls voted for basketball? • How many girls voted for track or soccer? • How many more girls voted for basketball than softball?
Look at the graph to the right. Use it to answer the questions below. (1) If the graph shows 200 students’ votes for their favorite music, which piece represents 58 votes for Rock? (2) Which piece represents 20 votes for classical music? (3) How many people voted for Pop music if it was the most popular? (4) How many people voted for Country music if it received 16% of the votes?
Which graph was most likely used to represent the information shown in the data table?