Download
1 / 27
320 likes | 531 Views
Bologna (Italy) 14-17 June 2005. WORKSHOP ON CLIMATIC ANALYSIS AND MAPPING FOR AGRICULTURE. “Procedures and guidance of appropriate zoning methodologies and promotion of their application”. CLIMATE ANALYSIS FOR THE ASSESSMENT OF VULNERABILITY TO DESERTIFICATION IN MEDITERRANEAN ENVIRONMENT.

E N D
Bologna (Italy) 14-17June 2005 WORKSHOP ON CLIMATIC ANALYSIS AND MAPPING FOR AGRICULTURE “Procedures and guidance of appropriate zoning methodologies and promotion of their application” CLIMATE ANALYSIS FOR THE ASSESSMENT OF VULNERABILITY TO DESERTIFICATION IN MEDITERRANEAN ENVIRONMENT R. Magno, A. Crisci, L. Genesio –Ibimet CNR
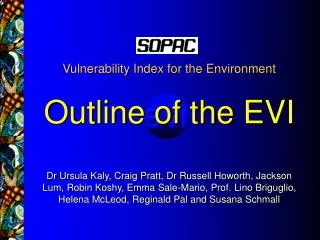
WORKSHOP ON CLIMATIC ANALYSIS AND MAPPING FOR AGRICULTURE Bologna (Italy) 14-17June 2005 DESERTIFICATON Desertification is “land degradation(*) in arid, semiarid and dry sub-humid areas due to various factors, including climatic variations and human activities” (UNCCD) (*)Land degradation = loss of soil productivity The aims of the UNCCD and the National Action Plans are: • to assess areas subjected to a desertification risk, adopting methodologies repeatable in several socio-geographical context • to provide tools for the public authority to prevent and mitigate such phenomenon, in order to ensure a sustainable land planning • monitoring the evolution of the land degradation processes
WORKSHOP ON CLIMATIC ANALYSIS AND MAPPING FOR AGRICULTURE Bologna (Italy) 14-17June 2005 DISMED and DESERTNET Projects The international and inter-regional DISMED and DESERTNET-Interreg IIIB MEDOCC projects have been developed on the basis of the climatic analysis to identify the desertification sensitive areas, to produce thematic maps and to implement the approved methodology of ESAs (MEDALUS Project), that analyses the various components of the land degradation process The large number of climatic, biological, pedological and socio-economical indicators that can be used in the ESAs (Environmental Sensitive Areas to desertification) methodology make it versatile and applicable to the various geographical context
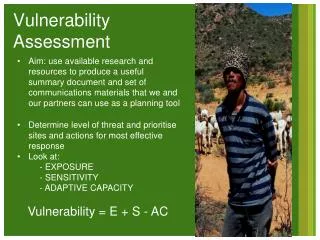
WORKSHOP ON CLIMATIC ANALYSIS AND MAPPING FOR AGRICULTURE Bologna (Italy) 14-17June 2005 THE CONTRIBUTION OF IBIMET-CNR • To suggest a proper methodology for the definition of the hydrological balance esteem, in terms of desertification and land degradation due to the climate factorsat different scale (from regional to local) • Implementation of the climate analysis methods at regional level (Mediterranean basin) and at local level (Tuscany) in order to develop a cartography of the desertification sensitivity (Aridity index) • Integration of the climate analysis with vegetation, soil and human pressure indices to define critical areas for the Tuscany region
WORKSHOP ON CLIMATIC ANALYSIS AND MAPPING FOR AGRICULTURE Bologna (Italy) 14-17June 2005 CLIMATIC ANALYSIS Parameters: - Rainfall (daily and monthly data) - Min, max and mean temperature (daily and monthly data) - ETP Thornthwaite “corrected” (monthly data) Period of analysis: - 1961/1990 (reference 30 years for IPCC-WMO) - 1991/2000 (current period) (Tuscany) Time scale: - Year - Season - Month Spatialization of meteorological data: analysis of several methods Final products: - Maps of AI (Aridity Index) - Percentage of AI variation (Tuscany) - SPI Standardized Precipitation Index (Tuscany)
WORKSHOP ON CLIMATIC ANALYSIS AND MAPPING FOR AGRICULTURE Bologna (Italy) 14-17June 2005 METEOROLOGICAL INDICATORS MONITORING Hence the need to have widespread, accurate and continuous monitoring of temperature, rainfall and all phenomena related to them. REMOTE SENSING OBSERVATIONS (homogeneous distribution) MONITORING METEOROLOGICAL GAUGES DATA (scattered and not continuous) but - GEOSTATISTICS methods of climatic parameters estimation - Data availability on a long period
WORKSHOP ON CLIMATIC ANALYSIS AND MAPPING FOR AGRICULTURE Bologna (Italy) 14-17June 2005 Spatialization of climatic data: RMSE analysis Monthly min temperature Monthly max temperature Thermometric data: substantially affected by geographic characteristics of the area Monthly rainfall Rainfall data: random properties of spatial variability
360 + 120 FILES RAINFALL PERIOD 1961-90 1991-00 Available stations 12*30 + 12*10 RASTER MAPS COKRIGING RAINFALL ARIDITY INDEX CLIMATIC DATA SPATIALIZATION ETP 12*30 + 12*10 RASTER MAPS 2 MAPS (61-90; 91-00) Penman Tthornthwaite TEMPERATURE ETP Thornthwaite PERIOD 1961-90 1991-00 Available stations TEMP. 360 + 120 FILES 12*30 + 12*10 RASTER MAPS CLIMATIC DATABASE PENMAN CORRECTION Underestimate in particularly dry areas MULTIREGRESSIVE + KRIGING OF RESIDUALS
WORKSHOP ON CLIMATIC ANALYSIS AND MAPPING FOR AGRICULTURE Bologna (Italy) 14-17June 2005 Mean Yearly Temperature: 1961-1990 period for the Mediterranean area
WORKSHOP ON CLIMATIC ANALYSIS AND MAPPING FOR AGRICULTURE Bologna (Italy) 14-17June 2005 Mean Yearly Precipitation: 1961-1990 period for the Mediterranean area
WORKSHOP ON CLIMATIC ANALYSIS AND MAPPING FOR AGRICULTURE Bologna (Italy) 14-17June 2005 Mean Yearly Evapotranspiration: 1961-1990 period for the Mediterranean area
WORKSHOP ON CLIMATIC ANALYSIS AND MAPPING FOR AGRICULTURE Bologna (Italy) 14-17June 2005 Mean Yearly Aridity Index: 1961-1990 period for the Mediterranean area
WORKSHOP ON CLIMATIC ANALYSIS AND MAPPING FOR AGRICULTURE Bologna (Italy) 14-17June 2005 SAME APPROACH - DIFFERENT SCALE Using DISMED approach, DESERTNET Project emphasize the dynamic feature of the climate analysis Following the ESAs methodology, other specific aspects of desertification process on the Tuscany region are taken in to account (vegetation, soil, land management, human pressure)
WORKSHOP ON CLIMATIC ANALYSIS AND MAPPING FOR AGRICULTURE Bologna (Italy) 14-17June 2005 DESERTNET Project: the TUSCANY case THE ARIDITY INDEX ANALYSIS Aridity can affect a region during a specific period, season or even all over the year For a good land management is important to know when the critical period occurs YEAR TIME SCALE SEASON The annual analysis of more then 100 gauges in Tuscany did not show any areas affected by the aridity. But in fact, a large part of the region has turned out to be semi-arid or sub-humid dry in spring and summer seasons.
WORKSHOP ON CLIMATIC ANALYSIS AND MAPPING FOR AGRICULTURE Bologna (Italy) 14-17June 2005 ANNUAL ARIDITY INDEX At the annual level the low ETP and the autumn and winter rainfall mitigate the aridity
SPRING ARIDITY INDEX SUMMER ARIDITY INDEX At the seasonal level, particularly in spring and summer periods, a large portion of Tuscany suffers from a strong aridity (0.2-0.5 is the range of semi-arid zones in the UNEP classification) This phenomenon can greatly affect the agricultural activities and the yield production
WORKSHOP ON CLIMATIC ANALYSIS AND MAPPING FOR AGRICULTURE Bologna (Italy) 14-17June 2005 DINAMIC ANALYSIS OF ARIDITY INDEX Negative value = decreasing of aridity in the last 10 years Positive value = increasing of aridity in the last 10 years
WORKSHOP ON CLIMATIC ANALYSIS AND MAPPING FOR AGRICULTURE Bologna (Italy) 14-17June 2005 DROUGHT IN TUSCANY: the SPI Agricultural drought events Not unusual during hottest season In the last decade increase in winter Winter drought events are not limited in the arid areas, but are diffused in most of the Tuscany region
WORKSHOP ON CLIMATIC ANALYSIS AND MAPPING FOR AGRICULTURE Bologna (Italy) 14-17June 2005 WINTER SPI
WORKSHOP ON CLIMATIC ANALYSIS AND MAPPING FOR AGRICULTURE Bologna (Italy) 14-17June 2005 SPI MAPS % of drought events frequency % of drought events frequency variation
ESAI - Environmental Sensitive Areas Index ESAI = (CQI * SQI * VQI * MQI * HPI)1/5 CQI MQI VQI HPI SQI
VULNERABILITY TO DESERTIFICATION: OVERLAP OF CRITICAL AREAS Sibolla lake Portata del fiume Arno a Subbiano Turist density - year 2000 Annual net balance of CO2 WORKSHOP ON CLIMATIC ANALYSIS AND MAPPING FOR AGRICULTURE Bologna (Italy) 14-17June 2005 ESAI
WORKSHOP ON CLIMATIC ANALYSIS AND MAPPING FOR AGRICULTURE Bologna (Italy) 14-17June 2005 CQI - Climatic Quality Index CQI = (AI61-90 * % AI61-00 Var.* Drought Freq.61-90 * % Drought Freq 00-61 Var. )1/4
VQI - Vegetation Quality Index Rischio strutturale di incendio Copertura da NDVI (TM) WORKSHOP ON CLIMATIC ANALYSIS AND MAPPING FOR AGRICULTURE Bologna (Italy) 14-17June 2005 VQI = (Erosion protection * Drought resistance * Land cover * Fire risk)1/4
WORKSHOP ON CLIMATIC ANALYSIS AND MAPPING FOR AGRICULTURE Bologna (Italy) 14-17June 2005 MQI - Management Quality Index MQI = (Protection policies * Land management)1/2 Environmental policy = (National parks * Regional parks * Directive Habitat 92/43-Bioitaly)1/3 Land management = ((var % SAU/municipal area) * (SAU bio/SAU) * (SAU irrigated/SAU) * (grass-pasture/SAU) * (UBA/SAU))1/5
HPI – Human Pressure Index WORKSHOP ON CLIMATIC ANALYSIS AND MAPPING FOR AGRICULTURE Bologna (Italy) 14-17June 2005 HPI = (Population density 2001 * % ofpopulation density variation2001-1961 * Tourist density2001 * % Tourist density variation2001-1993)1/4
WORKSHOP ON CLIMATIC ANALYSIS AND MAPPING FOR AGRICULTURE Bologna (Italy) 14-17June 2005 CONCLUSIONS • The results of the two DISMED and DESERTNET Project show that the climate analysis and its dynamic variation are of great importance for defining the desertification vulnerability at different scales • Sensitive areas are affected by a various critical factors and elements that determine the loss of productivity of the soil; but not necessarily the same level of vulnerability is due to the overlap of the same critical factors • Nevertheless in areas affected by negative climate conditions human pressure accelerate land degradation processes • Is possible to compare the map of desertification vulnerability with maps of other types of environmental problems