Download
1 / 19
190 likes | 353 Views
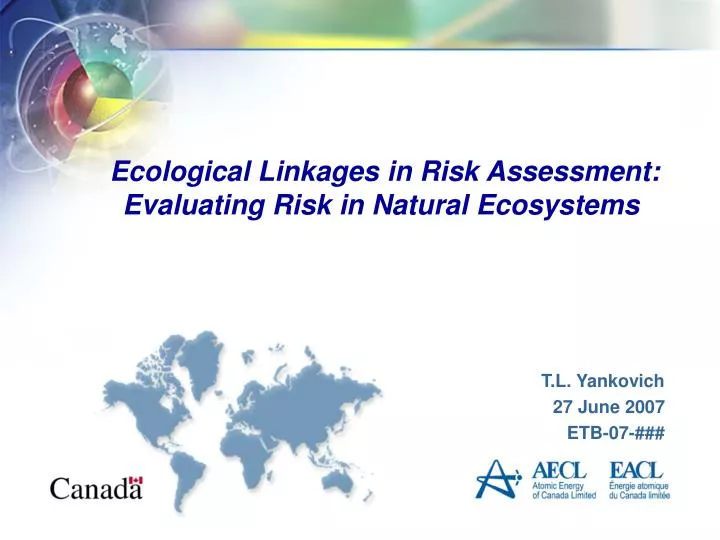
Ecological Linkages in Risk Assessment: Evaluating Risk in Natural Ecosystems. T.L. Yankovich 27 June 2007 ETB-07-###. Outline:. Background Information Key Aspects and Framework Risk Assessment Approach Conclusions and Future Considerations.

E N D
Ecological Linkages in Risk Assessment: Evaluating Risk in Natural Ecosystems T.L. Yankovich 27 June 2007 ETB-07-###
Outline: • Background Information • Key Aspects and Framework • Risk Assessment Approach • Conclusions and Future Considerations
Ecological Risk Assessment (ERA) Framework(from Environment Canada 1997) PROBLEM FORMULATION
Key Components of Problem Formulation i.e.: ‘What’ we want to protect. • Identification of Valued Ecosystem Components (VECs) and corresponding/comparable receptor species. • Screening/identification of contaminants of potential environmental concern (COPECs). • Evaluation of the potential overlap between COPECs and biota. i.e.: ‘What’ we want to protect from. i.e.: ‘Where’ we should focus our efforts.
Weighing Out the Risks • The level at which potential for exposure and effects is typically assessed using a multi-tiered approach. • Initially, a hyper-conservative approach is undertaken for SCREENING purposes. Tier 1 • A more detailed assessment of exposure and in some cases, effects, is then performed. Tier 2 and possibly Tier 3 • Mitigation and/or remediation may then be considered, depending upon the outcomes. AND/OR
Key Components of Entry Characterization • Identification of key contaminant entry pathways key compartments. • Characterization of source/emissions through monitoring. • Assessment of process. • Evaluation of source pathways. • Consideration of expected contaminant behaviour. • Identification of contaminants of potential environmental concern (COPECS).
Key Components of Exposure Characterization • Characterization of exposure COPEC concentrations in key compartments for key receptor species. • Characterization of species inventory. • Identification of valued ecosystem components (VECs) and corresponding receptor biota. • Compilation of relevant biological attributes and parameter values for selected species. • Where possible, measurement of site-specific transfer parameters.
Estimation of Total Dose DTOT or EEV = DE + DI where: • DTOT is the total dose to biota; • DE is the total external dose from all radionuclides to which biota are being exposed; and • DI is the total internal dose from all radionuclides to which biota are being exposed.
Estimation of Total External Doseto Aquatic Biota DER = [COR,W UW DCCEWR] + [COR,S US DCCESR] + [COR,V UV DCCEVR] where: • COR,(W,S,V) is the concentration of radionuclide (R) in water (W), sediments (S) or vegetation (V) (Bq·L-1 or Bq·kg-1); • UW, US and UV are the habitat-use factors of biota for water, sediments and vegetation, respectively (dimensionless); and • DCFEWR, DCFESR and DCFEVR are the external dose conversion factors for water, sediments, and vegetation, respectively (based on Amiro, 1997).
Estimation of Total Internal Doseto Aquatic Biota DIR = BAFR x COW x DFR x DCCIR Radionuclide (R) Concentration In Biota Tissue where: • BAFR is the bioaccumulation factor for radionuclide, R (L/kg fresh weight); • COW is the concentration of radionuclide, R, in the water (Bq/L); • DFR is a distribution factor to account for a disproportionate internal distribution of radionuclide, R (dimensionless); and • DCCIR is internal dose conversion coefficient for radionuclide, R.
Unlike Aquatic Biota • Terrestrial biota are sub-divided into those that spend time aboveground and those that spend time belowground, or a combination of the two with respect to external dose estimation (as recommended by Sample et al., 1997).
Estimation of Total External Dose toAboveground Terrestrial Biota where: • Dabovegroundrepresents the external dose rate from aboveground exposure to contaminated soil (Gy/a); • Faboveground is the proportion of time spent above ground (dimensionless); • Froughness factor is the dose rate reduction factor accounting for surface roughness of soil (dimensionless), which is assumed to have a default value of 0.7 (as recommended by Sample et al., 1997); • Csoil,Rrepresents activity of radionuclide, R, in surface soil (Bq/kg dry); • DCground,R is the dose coefficient factor for radionuclide, R, in soil contaminated to a given depth (Sv/s per Bq/m3) (from Eckerman and Rymann, 1993); • CFb is the conversion factor to change Sv/s per Bq/m3 to Gy/a per Bq/kg (is equal to 5.05 x 10¹⁰); and • ECF is the elevation correction factor to adjust dose coefficients to value representative of effective height of animal aboveground (which is assumed to be 2 for small mammals and other species that are <1 m from the soil surface and 1 for taller animals that are >1 m from the soil surface).
Estimation of Total External Dose toBelowground Terrestrial Biota where: • Dbelowground represents the external dose rate to non-human biota from contaminated soil (Gy/a); • Fbelowground is the proportion of time spent below ground (dimensionless); • Csoil,Rrepresents activity of radionuclide, R, in surface soil (Bq/kg dry); • ER is the total energy of all g emissions (MeV/nuclear transition) (from Blaylock, 1993); • 1.05 is a conversion factor to account for immersion in soil versus water; and • CFa is the conversion factor to convert from MeV/nuclear transition to Gy·kg/Bq·a (5.05x10⁻⁶).
Application of Allometric Modelsto Estimate Internal Dose • For aquatic organisms, such as mammalian and avian species, as well as similar species in terrestrial environments, exposure is estimated based on allometric estimation of exposure via key pathways, with estimation of fractional radionuclide uptake based on diet. Where: is Cm,Ris the concentration of radionuclide R in medium m (Bq/kg fresh or Bq/L); BTFR is the biotransfer factor of radionuclide,R (d/kg); ft is the fraction of time an animal spends at the site of interest; fd is the fraction of the diet of an animal that consists of food from the site of interest.
Estimation of Intake Rates for VariousTypes of Receptor Biota where: • Y is the predicted biological function (e.g. food ingestion rate); • Wt the fresh weight of the animal (in kg or g); and • a and b are fitted empirical coefficients that were quantified based on data representing many observations of one broad characteristic group (e.g. food intake rates measured for many mammals).
Key Components of Effects Characterization • Identification of relevant potential effects to key receptor biota. • Compilation of relevant effects benchmarks (typically based on regulatory guidance and/or literature).
Potential Exposure Must Then BeConsidered With Respect toPotential Risk Site-Specific Exposure Expected Exposure Value Effects Benchmark Value Potential Risk= Regulatory Guidelines