Download
1 / 50
500 likes | 635 Views
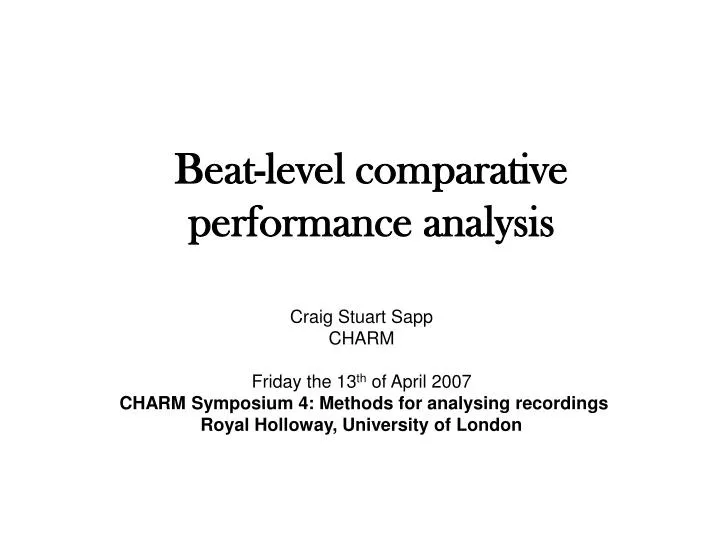
Beat-level comparative performance analysis. Craig Stuart Sapp CHARM Friday the 13 th of April 2007 CHARM Symposium 4: Methods for analysing recordings Royal Holloway, University of London. Mazurka Project. 2,076 recordings of 49 mazurkas. = 42 performances/mazurka on average

E N D
Beat-level comparative performance analysis Craig Stuart Sapp CHARM Friday the 13th of April 2007 CHARM Symposium 4: Methods for analysing recordings Royal Holloway, University of London
Mazurka Project • 2,076 recordings of 49 mazurkas = 42 performances/mazurka on average least: 30 performances of 41/1 most: 60 performances of 63/3 Performers of mazurka 63/3: • 99 performers on 150 CDs, 93 hours of music • Earliest is 1907 Pachmann performance of 50/2 Number of performance by decade number of mazurka performances in each decade see mazurka.org.uk/info/discography
1. Data Extraction: • Beat durations/tempo • Beat loudnesses
mazurka in A minor, Op. 17, No. 4, m. 18 Reverse conducting Frederic Chiu, 1999 Édouard Risler, 1920
Manual correction of taps Using audio annotation plugins for Sonic Visualiser http://www.sonicvisualiser.org http://sv.mazurka.org.uk MzSpectralReflux MzHarmonicSpectrum Frederic Chiu, 1999 Édouard Risler, 1920 mazurka in A minor, Op. 17, No. 4, m. 18
120 110 80 140 100 180 300 All note events time between events: (milliseconds) rubato Where does beat 18:1 start? • non-beat timings extracted with Andrew’s program. • individual note loudness extracted with Andrew’s program. 0-25 ms = not audible 25-50 ms = slightly audible 50+ ms = audible 100+ ms = clearly audible mazurka in A minor, Op. 17, No. 4, m. 18
2. Analysis Concepts: • Scape plots • Correlation
Scape plotting domain • 1-D data sequences chopped up to form a 2-D plot • Example of a composition with 6 beats at tempos A, B, C, D, E, and F: analysis window size original sequence: end time axis start
Scape plotting domain (2) • 1-D data sequences chopped up to form a 2-D plot • Example of a composition with 6 beats at tempos A, B, C, D, E, and F: Landscape: background large-scale structures middleground small-scale structures foreground surface features
Scape plotting domain (3) • 1-D data sequences chopped up to form a 2-D plot • Example of a composition with 6 beats at tempos A, B, C, D, E, and F: Landscape: background large-scale structures middleground small-scale structures foreground surface features Example using averaging in each cell: average of all 6 numbers (6+2+5+8+4) 5 25 5 average of last 5 numbers = = 5 12 2 (8+4) 2 = = 6
faster average for performance slower Average-tempo timescapes Mazurka in F maj. Op. 68, No. 3 average tempo of entire performance Chiu 1999 phrases
Correlation • Measures how well two shapes match: Pearson correlation: r = 1.0 is an exact match. r = 0.0 means no relation. output range: -1.0 to +1.0
Bi Br Ch Fl In Lu R8 R6 Sm Un Performance tempo correlations Biret Brailowsky Chiu Friere Indjic Luisada Rubinstein 1938 Rubinstein 1966 Smith Uninsky Highest correlation to Biret Lowest correlation to Biret
3. Analysis Techniques • Performance maps • Correlation scapes • Performance scapes
Correlation Maps – nearest neighbor • Draw one line connecting each performance to its closest correlation match • Correlating to the entire performance length. Mazurka 63/3
Correlation Maps – adding the average • synthetic average generated by averaging duration of each beat in each performance
Arch correlation scapes 2-bar arches 8-bar arches
Binary correlation scapes window size (in measures) white = high correlation black = low correlation 64 56 48 40 32 24 16 8 Yaroshinsky 2005 Yaroshinsky 2005 Ashkenazy 1982 Jonas 1947 mazurka 30/2
3D view of a correlation scape Low correlation = valley High correlation = peak Low correlation = black High correlation = white mazurka 30/2
Search for best correlations at each point in all plots 2. superimpose all analyses. Yaroshinsky/ Milkina Yaroshinsky/ Friedman Yaroshinsky/Rubinstein Yaroshinsky/Rangell Yaroshinsky/Freneczy • correlate one performance to all others – assign unique color to each comparison. 3. look down from above at highest peaks
Perormance correlation scapes • Who is most similar to a particular performer at any given region in the music? mazurka.org.uk/ana/pcor-gbdyn mazurka.org.uk/ana/pcor
Nearest neighbors in detail correlation maps only use tip of triangle: Component performances: • Causes: • direction relation (e.g., teacher) • indirect relation (e.g., school) • random chance Yaroshinsky 2005 Mazurka in B minor, 30/2
Boring timescape pictures over-exposed photographs -- throw them in the waste bin. The same performance by Magaloff on two different CD re-releases: Philips 456 898-2 mazurka 17/4 in A minor Philips 426 817/29-2 • Structures at bottoms due to errors in beat extraction, measuring limits in beat extraction, and correlation graininess.
Concert Artist 20012 Calliope 3321 Boring timescape pictures? Two difference performances from two different performers on two different record labels from two different countries. mazurka 17/4 in A minor Hatto 1997 Indjic 1988 see www.charm.rhul.ac.uk/content/contact/hatto_article.html
Same performer over time Same work; same pianist; different performances mazurka in A minor 17/4 1962 1952 1939 see mazurka.org.uk/ana/pcor/mazurka17-4-noavg
Same performer over time Same work; same pianist; different performances mazurka in A minor 17/4 1962 1952 1939 Perahia owns 1939 recording Ashkenazy owns 1952 recording see mazurka.org.uk/ana/pcor/mazurka17-4-noavg
Strong interpretive influences Shebanova 2002 Poblocka 1999 Tsujii 2005 Nezu 2005 Falvay 1989 Mazurka in C Major 24/2
Dynamics + Tempo scapes Falvay 1989 Chiu 1999 timescape: dynascape: dymescape(?):
Peeling layers of the Onion remove Average remove Hatto remove Fliere remove Gierzod remove Uninsky remove Friedman remove Osinksa remove Czerny-Stefanska
Scape Rank Indjic 1988: 0. Indjic 1988: 100.0% * 59/59 1. Hatto 1997: 99.7% * 58/59 2. Average: 73.2% * 57/59 3. Gierzod 1998: 19.3% * 56/59 4. Fliere 1977: 26.6% * 55/59 5. Uninsky 1971: 21.9% * 54/59 6. Friedman 1923: 13.8% * 53/59 7. Osinska 1989: 13.9% * 52/59 8. Czerny-Stefanska 1949: 13.4% * 51/59 9. Shebanova 2002: 16.9% * 50/59 10. Harasiewicz 1955: 12.6% * 49/59 11. Boshniakovich 1969: 14.6% * 48/59 12. Schilhawsky 1960:16.7% * 47/59 13. Afanassiev 2001:22.8% * 46/59 14. Neighaus 1950: 17.3% * 45/59 15. Friedman 1930: 20.0% * 44/59 16. Poblocka 1999: 14.1% * 43/59 = 1.00 = .979 = .707 = .183 = .247 = .200 = .124 = .122 = .115 = .142 = .105 = .119 = .132 = .178 = .132 = .149 = .103 P R R P P P P P R A R R P P In the future: scape-rank performance maps…
Observations • Recordings have a strong influence on mazurka performance practice. • Internationalization • Pianists maintain a stable performance tempo structure over long career. • Rubinstein • Uninsky • Ts’ong • Friedman • Horowitz • Cortot c.f. Bruno Repp • Like Per Dahl’s observations: pianists getting closer to the “average” • also slowing down over time. • Like Daniel Barolsky’s observations: dynamics more variable than timing. Slides online: http://mazurka.org.uk/info/present/charm-20070413
Dynamics & Phrasing 1 2 3 all at once: rubato
Average tempo over time • Performances of mazurkas slowing down over time: Indjic 2001 Rubinstein 1966 Friedman 1930 • Slowing down at about 3 BPM/decade Laurence Picken, 1967: “Centeral Asian tunes in the Gagaku tradition” in Festschrift für Walter Wiora. Kassel: Bärenreiter, 545-51.
Average Tempo over time (2) • The slow-down in performance tempos is unrelated to the age of the performer
Tempo graphs http://mazurka.org.uk/ana/tempograph
Mazurka Meter C A (A) B A A D • Stereotypical mazurka rhythm: • First beat short • Second beat long Mazurka in A minor Op. 17, No. 4 measure with longer second beat measure with longer first beat • blurred image to show overall structure
Maps and scapes Correlation maps give gross detail, like a real map: Correlation scapes give local details, like a photograph:
Comparison of performers rubato
Absolute correlation without average • Correlation maps are showing best correlations for entire performances
Correlation trees Mazurka in A minor, 68/3
Correlation tree Mazurka in A minor, 17/4
Beat-Event Timing Differences difference plot Hatto beat location times: 0.853, 1.475, 2.049, 2.647, 3.278, etc. Indjic beat location times: 0.588, 1.208, 1.788, 2.408, 3.018, etc. Hatto / Indjic beat time deviations remove 0.7% timeshift deviation [seconds] beat number
How time + dynamics are mixed Correlation: original tempo sequence t_n = (t1, t2, t3, t4, t5, t6, t7, t8, …, tn) d_n = (d1, d2, d3, d4, d5, d6, d7, … dn) original dynamic sequence J_n = (Jt1, Jd1, Jt2, Jd2, Jt3, Jd3, …, Jtn, Jdn) joint sequence original dynamic sequence is scaled to match tempo sequence’s mean and standard deviation: original time sequence is unaltered: