Download
1 / 16
160 likes | 166 Views
Onion creek catchment modeling using PIHM. By, Harish Sangireddy PhD Candidate The University of Texas at Austin. What is PIHM?. Penn State Integrated Hydrologic Modeling system It is a distributed hydrologic model that incorporates Channel routing Surface overland flow Subsurface flow

E N D
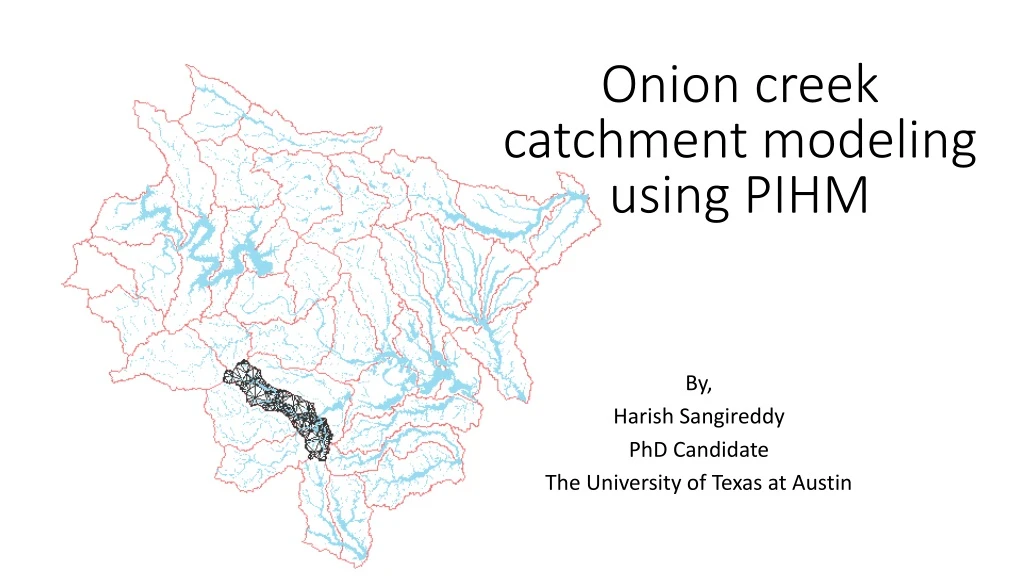
Onion creek catchment modeling using PIHM By, Harish Sangireddy PhD Candidate The University of Texas at Austin
What is PIHM? • Penn State Integrated Hydrologic Modeling system • It is a distributed hydrologic model that incorporates • Channel routing • Surface overland flow • Subsurface flow • Snow melt • Evapotranspiration via a semi-discrete approach with FVM.
Procedural framework of PIHM • Raster processing • Vector processing • TIN generation ( domain decomposition) • Data model loader • mesh, att, riv, para, soil, geol, LC, Init, calib, Forc • Run PIHM • Information visualization • Temporal • Spatial
Outputs from PIHM Time series plots Spatial plots Saturated state, unsaturated state Evaporation from Canopy Transpiration, and Infiltration Inflow, Outflow, Base flow, Surface flow
Onion Creek Travis County
Onion creek • 30 m DEM used • After pit filling was performed, an area threshold of 7588 m^2 was suggested by PIHM to create stream lines • Subsequently the vector processing was done and the TIN was generated for the entire Onion creek. • The forcing data for this experiment is from 2005 - 2009
Onion creek Geology • 30 m DEM used • After pit filling was performed, an area threshold of 7588 m^2 was suggested by PIHM to create stream lines • Subsequently the vector processing was done and the TIN was generated for the entire Onion creek.
Onion creek Land cover • 30 m DEM used • After pit filling was performed, an area threshold of 7588 m^2 was suggested by PIHM to create stream lines • Subsequently the vector processing was done and the TIN was generated for the entire Onion creek.
Onion creek Soil type • 30 m DEM used • After pit filling was performed, an area threshold of 7588 m^2 was suggested by PIHM to create stream lines • Subsequently the vector processing was done and the TIN was generated for the entire Onion creek.
Model settings Uniform climate conditions used The soil, geology, land cover of HUC 12 was used
Model settings Initial conditions were set to zero
Time series visualization from PIHM outputs Diurnal signal Simulated over a 7 day period Uniform distribution of climate variables assumed.
Spatial data visualization Evapotranspiration Unsaturated zone head Correlates well with the land cover
Saturate zones mapped with warning zones Good spatial correlation between saturated zones identified by the PIHM model, and the warning zones from FEMA, even when the soil and geology characteristics are not accurate representation of the region.
Caveats of this experiment • In order to run PIHM, the soil characteristics requires a compilation of the silt %, sand %, and clay % of each soil type in the HUC12. • Similarly the geology input file for PIHM needs information about the hydraulic conductivity, porosity, Van Genuchten soil parameters and some more. • The data preprocessor shipped with PIHM source code does not convert the raw data to data format as required the PIHM correctly always for soil and geology type. • Hence the first few runs of the PIHM model failed. • Although the soil and geology data was available for this region, the results that I present do not accurately represent the soil and geology characteristics of the onion creek. I was only able to find the silt %, sand %, and clay % of a few mukey ids only.
Conclusions and Future work • I adjusted the shell scripts for PIHM to make it run on windows machine. • The preprocessor to PIHM cannot handle large time series as it runs out of memory. Hence simulations using more than 4 years of forcing data are difficult to run now. • By changing the soil and geology parameters, we can get better estimates of outflow. • Also the vector processing needs some manual intervention to make the TIN appropriately. • I am going to use the SSURGO tables chorizon to get the real estimates of silt, clay and sand percentages for each mukeyand re-run the PIHM model again.